
Ask
your own question, for FREE!
History
9 Online
 bill533:
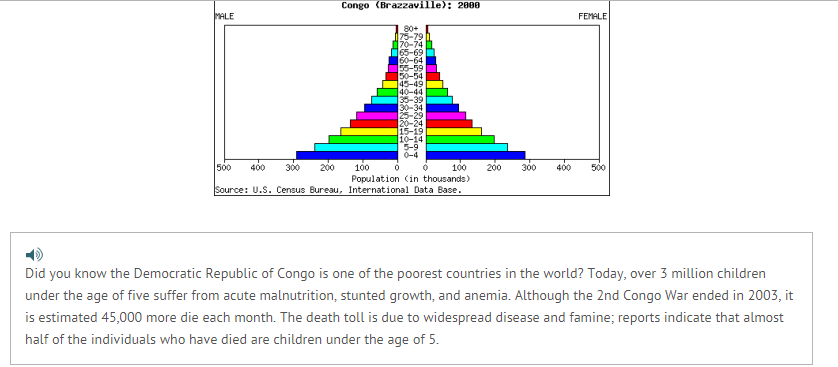
Consider the most recent information of the situation in the Congo as provided by the World Food Programme. Based on this information, predict how a new population graph would look. A) A decrease overall, beginning with the band representing 0 - 4. B) A decrease in population overall, beginning with the 5 - 9 band. C) An increase in the population throughout the graph because the war was halted in 2003. D) A wider band for the youngest ages, with a dramatic decrease once the population age reaches 20+.
Still Need Help?
Join the QuestionCove community and study together with friends!
 bill533:
@Shadow
bill533:
i think the answer is C
bill533:
@lowkey
Can't find your answer?
Make a FREE account and ask your own questions, OR help others and earn volunteer hours!
Join our real-time social learning platform and learn together with your friends!
Join our real-time social learning platform and learn together with your friends!
Latest Questions
 Kimmee1001:
Who or what is ultimately responsible for Romeo and Juliet's deaths?
 EdwinJsHispanic:
is it normal to have high expectations, like expecting your partner to have time
 gelphielvr:
Advice for cramming 70 vocab terms each week? Taking med term this year and we have to memorize about 70+ vocab terms per week and im having trouble studyin
EdwinJsHispanic:
I lowk need help deciding what I should write/type on this essay about why teache
 GRIZZLEY19:
Let me know what y'all think about the story Image waking up and seeing a family in the dark.
VERNEISH:
Two objects are moving along separate linear paths where each path is described by position, d, and time, t.
 Kimmee1001:
Who or what is ultimately responsible for Romeo and Juliet's deaths?
10 hours ago
1 Reply
0 Medals
EdwinJsHispanic:
is it normal to have high expectations, like expecting your partner to have time
1 day ago
4 Replies
1 Medal
gelphielvr:
Advice for cramming 70 vocab terms each week? Taking med term this year and we have to memorize about 70+ vocab terms per week and im having trouble studyin
1 day ago
4 Replies
0 Medals
EdwinJsHispanic:
I lowk need help deciding what I should write/type on this essay about why teache
14 hours ago
3 Replies
0 Medals
GRIZZLEY19:
Let me know what y'all think about the story Image waking up and seeing a family in the dark.
22 hours ago
22 Replies
6 Medals

 VERNEISH:
Two objects are moving along separate linear paths where each path is described by position, d, and time, t.
1 week ago
1 Reply
0 Medals