 noobpro78:
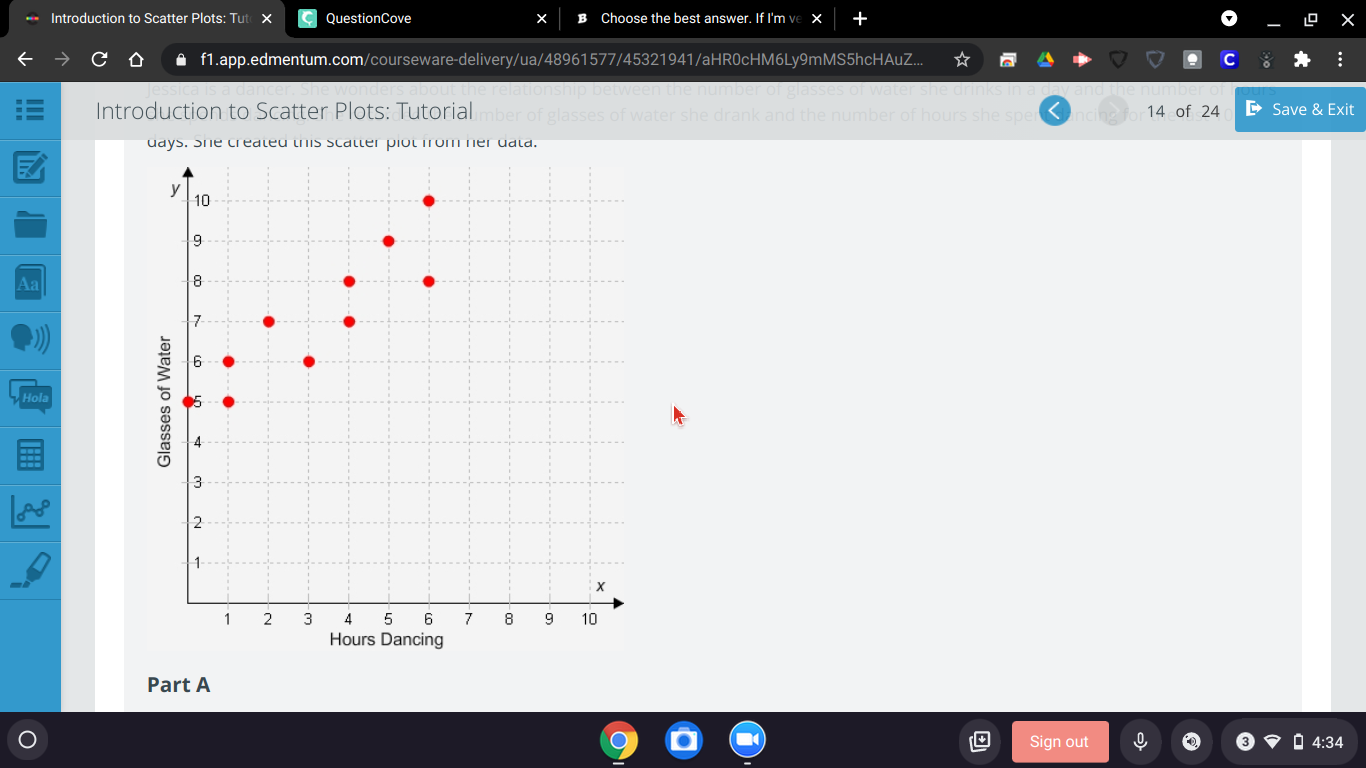
Determining Association This activity will help you meet these educational goals: Mathematical Practices—You will make sense of problems and solve them, reason abstractly and quantitatively, construct viable arguments and analyze the reasoning of others, use mathematics to model real-world situations, attend to precision, and look for and make use of structure. Directions Read the instructions for this self-checked activity. Type in your response to each question, and check your answers. At the end of the activity, write a brief evaluation of your work. Activity In this activity, you will examine the positive and negative associations shown by scatter plots. Question 1 Jessica is a dancer. She wonders about the relationship between the number of glasses of water she drinks in a day and the number of hours she spends dancing. She recorded the number of glasses of water she drank and the number of hours she spent dancing for the last 10 days. She created this scatter plot from her data.
 noobpro78:
Part A Does this scatter plot show a positive or a negative association?
 Extrinix:
Ok, so a positive association goes \(\rightarrow \uparrow\) and negative association goes \(\downarrow \rightarrow\) if you understand that
noobpro78:
is this for part a?
Extrinix:
Yes
noobpro78:
ok Part B Write a sentence that explains how the number of glasses of water Jessica drinks changes as the number of hours she spends dancing changes.
Extrinix:
So the sentence format should go: The (y value) changes as (x value) changes. OR The number of (y value) changes as the number of (x value) changes. your choice of wording.
noobpro78:
Question 2 Regina sets the price for an oil change at a car dealership’s service department. She wants to know if the number of service department customers changes as the price of an oil change changes. She recorded the number of service department customers and the oil change prices for the last 10 months. She created this scatter plot from her data.
 Extrinix:
Question-?
noobpro78:
yes look up
Extrinix:
there is no question included in that though.
noobpro78:
Question 2 Regina sets the price for an oil change at a car dealership’s service department. She wants to know if the number of service department customers changes as the price of an oil change changes. She recorded the number of service department customers and the oil change prices for the last 10 months. She created this scatter plot from her data.
noobpro78:
that question goes with that chart
Extrinix:
yea, but what are we supposed to be answering if she made the chart?
noobpro78:
oop sorry here you goPart A Does this scatter plot show a positive or a negative association?
Extrinix:
noobpro78:
ok? im still a little confused
Extrinix:
basically, a positive association continues going up and the negative continues going down
noobpro78:
Part B Write a sentence explaining how the number of customers changes as the oil change price changes.
Join our real-time social learning platform and learn together with your friends!
 Twaylor:
Time flies doesn't it? I tried to not be the second squeaky wheel of the household and ended up hurting myself and others severely.
Twaylor:
Time flies doesn't it? I tried to not be the second squeaky wheel of the household and ended up hurting myself and others severely.
 clllaaaaaire:
any tips? the quality isn't the best because I am using this site on my computer
clllaaaaaire:
any tips? the quality isn't the best because I am using this site on my computer
 Midnight97:
Kinda a roleplay story between me and my friend enjoy... Part one Forgive me for all the screenshots.
Midnight97:
Kinda a roleplay story between me and my friend enjoy... Part one Forgive me for all the screenshots.
 StevenisGhost:
what type of song should I make next, and will y'all go check out my new song on
Midnight97:
My drawing sure changed over the years look at these two pictures from 2024 to no
StevenisGhost:
what type of song should I make next, and will y'all go check out my new song on
Midnight97:
My drawing sure changed over the years look at these two pictures from 2024 to no
 EdwinJsHispanic:
"poem" love is So Beautiful to have. But it's so hard to have. At this point I don't know whether its worth the wait Or if it's just millions of miles to re
EdwinJsHispanic:
"poem" love is So Beautiful to have. But it's so hard to have. At this point I don't know whether its worth the wait Or if it's just millions of miles to re
EdwinJsHispanic:
"poem" love is So Beautiful to have. But it's so hard to have. At this point I don't know whether its worth the wait Or if it's just millions of miles to re
EdwinJsHispanic:
"poem" love is So Beautiful to have. But it's so hard to have. At this point I don't know whether its worth the wait Or if it's just millions of miles to re
 Breathless:
I don't know if this would be considered art, but its close enough I believe, Any
Breathless:
I don't know if this would be considered art, but its close enough I believe, Any