
Ask
your own question, for FREE!
Mathematics
13 Online
 niahmkk:
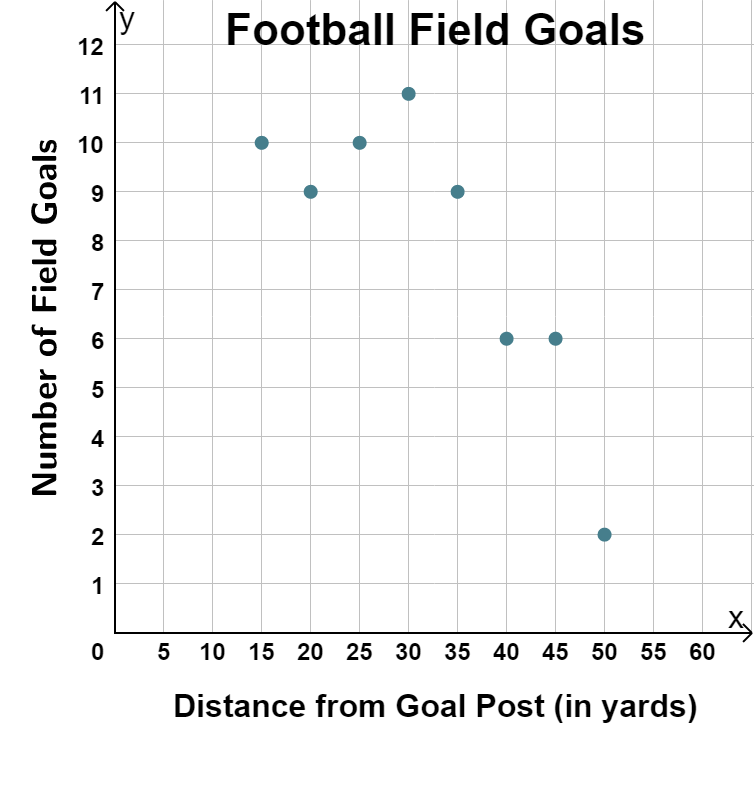
Which of the following tables of data represents the scatter plot? Distance From Goal Post (in yards) 15 20 25 30 35 40 45 50 Number of Field Goals 11 9 10 9 7 5 3 2 Distance From Goal Post (in yards) 11 9 10 9 7 5 3 2 Number of Field Goals 15 20 25 30 35 40 45 50 Distance From Goal Post (in yards) 15 20 25 30 35 40 45 50 Number of Field Goals 9 9 11 10 10 7 4 3 Distance From Goal Post (in yards) 15 20 25 30 35 40 45 50 Number of Field Goals 10 9 10 11 9 6 6 2
Still Need Help?
Join the QuestionCove community and study together with friends!
 niahmkk:
@renne
Can't find your answer?
Make a FREE account and ask your own questions, OR help others and earn volunteer hours!
Join our real-time social learning platform and learn together with your friends!
Join our real-time social learning platform and learn together with your friends!
Latest Questions
 VERNEISH:
Two objects are moving along separate linear paths where each path is described by position, d, and time, t.
 Maci:
what are the best stock apps for people who want to start investing?
 Twaylor:
genuienly how do i get better self control i keep watcing youtube and theres this
 IzzyCookie:
|dw:1792074056138:dw| Uhm, I don't know where to ask this, but I'm in college welding at my community college, and I need help learning vertical welding for
 thehearken:
not sure if this is considered spam, im sorry if it is, but does anyone have tips
VERNEISH:
Two objects are moving along separate linear paths where each path is described by position, d, and time, t.
17 hours ago
0 Replies
0 Medals
 Maci:
what are the best stock apps for people who want to start investing?
4 days ago
3 Replies
2 Medals
Twaylor:
genuienly how do i get better self control i keep watcing youtube and theres this
1 week ago
3 Replies
0 Medals
IzzyCookie:
|dw:1792074056138:dw| Uhm, I don't know where to ask this, but I'm in college welding at my community college, and I need help learning vertical welding for
2 days ago
9 Replies
1 Medal
 thehearken:
not sure if this is considered spam, im sorry if it is, but does anyone have tips
1 week ago
2 Replies
1 Medal