Ask
your own question, for FREE!
Mathematics
48 Online
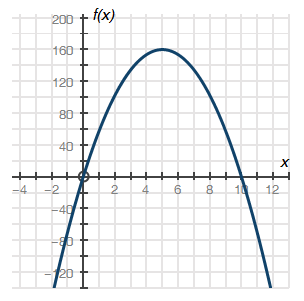
The graph below shows a company's profit f(x), in dollars, depending on the price of pencils x, in dollars, sold by the company: Part A: What do the x-intercepts and maximum value of the graph represent? What are the intervals where the function is increasing and decreasing, and what do they represent about the sale and profit? Part B: What is an approximate average rate of change of the graph from x = 2 to x = 5, and what does this rate represent? Part C: Describe the constraints of the domain.
Still Need Help?
Join the QuestionCove community and study together with friends!
oh
Can't find your answer?
Make a FREE account and ask your own questions, OR help others and earn volunteer hours!
Join our real-time social learning platform and learn together with your friends!
Join our real-time social learning platform and learn together with your friends!
Latest Questions
 whyjustwhy:
idk man, js wanted to explain what child hood looks like to me. growing up ur supposed to scrap ur knees and get dirty and get in trouble as a kid and be re
 14369420:
last spam add me on snap ud83dude0c :galaxy_1438ud83dude1aud83dude0cud83dude0c
 ItzJackyyyy:
I remember how it used to be between us when nothing else matter When it was just you and me Music, laughter, joyu2026 I miss you and I miss you could see i
 Alanaaaaaaa:
Daily challenge: what occurs twice in a week once in a year and never in a month?
 somnium:
if you're one of the people who spells gojo as go/jo, i automatically hate you. few exceptions apply.
1 minute ago
6 Replies
1 Medal
8 hours ago
3 Replies
0 Medals
10 hours ago
10 Replies
1 Medal
18 minutes ago
8 Replies
0 Medals
16 hours ago
0 Replies
0 Medals

