 rootbeer003:
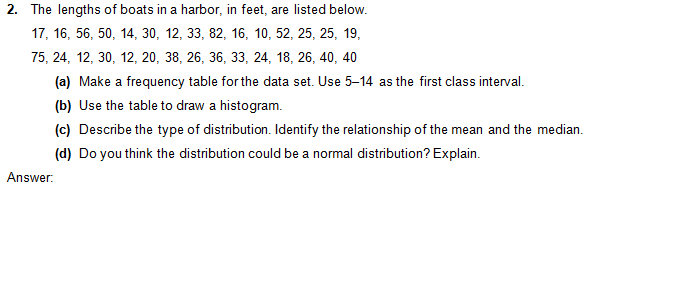
Help with algebra 2?
 Hero:
Hero:
Hi @rootbeer003 Have you attempted to create a frequency table yet?
rootbeer003:
No i have not
Hero:
Okay, so it says to use 5 - 14 as the first class interval when creating our frequency table. In other words, create interval sets of ten starting with 5 like so: 5 - 14 | 15 - 24| 25 - 34| 35 - 44| 45 - 54| 55 - 64| 65 - 74| 75 - 84|
rootbeer003:
Do u want me to write that down? the table
Hero:
So now we will list each of the items that occur within their respective interval. I will do the first interval: 5 - 14 | 10, 12, 12, 12, 14 15 - 24| 25 - 34| 35 - 44| 45 - 54| 55 - 64| 65 - 74| 75 - 84| @rootbeer003, Can you try listing the items that occur for the next interval?
Hero:
I'd prefer if you attempted to write the table down in the chat. You're free to also do it on a separate piece of paper first.
Hero:
I mean here, not in the chat.
rootbeer003:
5 - 14 | 10, 12, 12, 12, 14 15 - 24|16, 16,18,19,20,24 25 - 34| 35 - 44| 45 - 54| 55 - 64| 65 - 74| 75 - 84|
rootbeer003:
i might have missed one..
rootbeer003:
oh 17
rootbeer003:
5 - 14 | 10, 12, 12, 12, 14 15 - 24|16, 16,17,18,19,20,24 25 - 34| 35 - 44| 45 - 54| 55 - 64| 65 - 74| 75 - 84|
Hero:
5 - 14 | 10, 12, 12, 12, 14 15 - 24|16, 16, 17, 18,19,20,24 25 - 34| 25, 25, 26, 26, 30, 30, 33, 33 35 - 44| 45 - 54| 55 - 64| 65 - 74| 75 - 84|
Hero:
Your turn
rootbeer003:
5 - 14 | 10, 12, 12, 12, 14 15 - 24|16, 16, 17, 18,19,20,24 25 - 34| 25, 25, 26, 26, 30, 30, 33, 33 35 - 44| 36,38,40,40 45 - 54| 55 - 64| 65 - 74| 75 - 84|
Hero:
5 - 14 |10, 12, 12, 12, 14 15 - 24|16, 16, 17, 18,19,20,24 25 - 34|25, 25, 26, 26, 30, 30, 33, 33 35 - 44|36,38,40,40 45 - 54|50, 52 55 - 64| 65 - 74| 75 - 84|
Hero:
Almost there. Just three more rows to go.
rootbeer003:
5 - 14 | 10, 12, 12, 12, 14 15 - 24|16, 16, 17, 18,19,20,24 25 - 34| 25, 25, 26, 26, 30, 30, 33, 33 35 - 44| 36,38,40,40 45 - 54| 50,52 55 - 64| 56, 65 - 74| 75 - 84|75,82
Hero:
So now we should draw a histogram and in order to do that, we should first space these out properly: 5 - 14 |10, 12, 12, 12, 14 15 - 24|16, 16, 17, 18,19,20,24 25 - 34|25, 25, 26, 26, 30, 30, 33, 33 35 - 44|36, 38, 40, 40 45 - 54|50, 52 55 - 64|56, 65 - 74| 75 - 84|75, 82
rootbeer003:
Thats gunna be one long histogram
rootbeer003:
How will we start it?
Hero:
So the thing is, I used a particular website to create our histogram so let me show you something.
rootbeer003:
Ok
Hero:
|dw:1497051759026:dw|
rootbeer003:
Interesting, so would i try and redraw the first 1 or use the second one?
Hero:
Hang on. Let me post the histogram with the correct interval count
Hero:
|dw:1497052000024:dw|
Hero:
If you want to create your own, you can go here: http://www.shodor.org/interactivate/activities/Histogram/
Hero:
So now that we have it, now we can try to figure out which distribution type corresponds to the histogram.
Hero:
Do you already have a list of distribution types to choose from?
rootbeer003:
I dont
rootbeer003:
Do i put that pic on the paper too?
Hero:
You don't have your class notes which list them? Because there are many distribution types but for your class, it might only use maybe four rather than ten for example
rootbeer003:
Let me check
rootbeer003:
I doesnt say anything
rootbeer003:
only says ' the normal distribution '
Hero:
Seems strange. There are other distribution types besides that. Is there a way for you to share your notes?
rootbeer003:
OH idk if its what u need but it says this
rootbeer003:
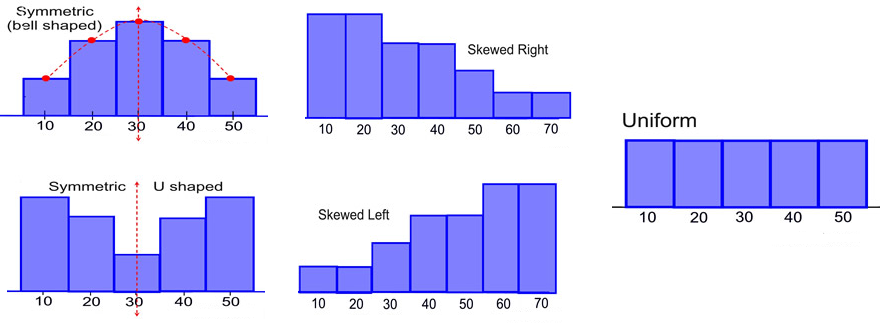
skewed distribution,bell-shaped distribution,uniform distribution ?
Hero:
There we go. Yes, that's what I was looking for. Cool, because there are so many different types of frequency distribution, there's no telling what terminology your particular class uses. Cool. So let me post something in response to that.
rootbeer003:
Ok ill be back in a few minutes while you look over that.
Hero:
Hero:
Okay, so these are the frequency distribution types your class is currently studying. So tell me, amongst the ones you see, which do you think best reflects that which we have created?
rootbeer003:
@Hero
rootbeer003:
Sorry my website keeps shutting down..
Join our real-time social learning platform and learn together with your friends!
 Twaylor:
Time flies doesn't it? I tried to not be the second squeaky wheel of the household and ended up hurting myself and others severely.
Twaylor:
Time flies doesn't it? I tried to not be the second squeaky wheel of the household and ended up hurting myself and others severely.
 clllaaaaaire:
any tips? the quality isn't the best because I am using this site on my computer
clllaaaaaire:
any tips? the quality isn't the best because I am using this site on my computer
 Midnight97:
Kinda a roleplay story between me and my friend enjoy... Part one Forgive me for all the screenshots.
Midnight97:
Kinda a roleplay story between me and my friend enjoy... Part one Forgive me for all the screenshots.
 StevenisGhost:
what type of song should I make next, and will y'all go check out my new song on
Midnight97:
My drawing sure changed over the years look at these two pictures from 2024 to no
StevenisGhost:
what type of song should I make next, and will y'all go check out my new song on
Midnight97:
My drawing sure changed over the years look at these two pictures from 2024 to no
 EdwinJsHispanic:
"poem" love is So Beautiful to have. But it's so hard to have. At this point I don't know whether its worth the wait Or if it's just millions of miles to re
EdwinJsHispanic:
"poem" love is So Beautiful to have. But it's so hard to have. At this point I don't know whether its worth the wait Or if it's just millions of miles to re
EdwinJsHispanic:
"poem" love is So Beautiful to have. But it's so hard to have. At this point I don't know whether its worth the wait Or if it's just millions of miles to re
EdwinJsHispanic:
"poem" love is So Beautiful to have. But it's so hard to have. At this point I don't know whether its worth the wait Or if it's just millions of miles to re
 Breathless:
I don't know if this would be considered art, but its close enough I believe, Any
Breathless:
I don't know if this would be considered art, but its close enough I believe, Any