 zarkam21:
Help please
 zarkam21:
@Vocaloid
 Mehek:
You would have to order the numbers from least to greatest first
 Vocaloid:
oof I would start by calculating the five number summary
Vocaloid:
first order them like Mehek said and then find min Q1 median Q3 max
Vocaloid:
these five numbers will give you an idea of what the boxplot looks like
zarkam21:
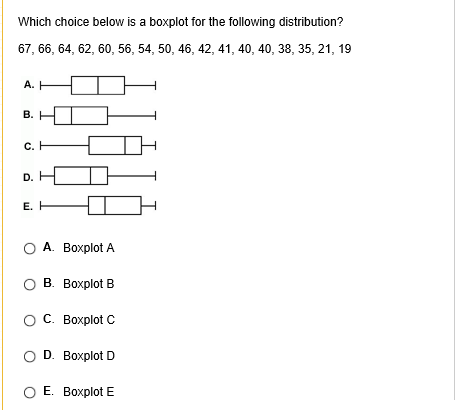
Median: 46 Minimum: 19 Maximum: 67 First quartile: 39 Third quartile: 61 Interquartile Range: 22 Outliers: none
Mehek:
Which box plot do you think matches the data?
zarkam21:
I think its d
zarkam21:
C
Vocaloid:
notice how the third quartile is close to the maximum the end of the "box" should be close to the right end of the plot
Vocaloid:
notice how the median is far away from Q3 the middle of the box should be far away from the right end of the box
zarkam21:
B
Vocaloid:
think about my clues and try drawing it without looking at the pictures
Vocaloid:
or better yet, take your values and create a box and whisker plot using those numbers (make sure it's to scale)
zarkam21:
E
zarkam21:
E
Vocaloid:
yes, E is correct
Join our real-time social learning platform and learn together with your friends!
 Twaylor:
Time flies doesn't it? I tried to not be the second squeaky wheel of the household and ended up hurting myself and others severely.
Twaylor:
Time flies doesn't it? I tried to not be the second squeaky wheel of the household and ended up hurting myself and others severely.
 clllaaaaaire:
any tips? the quality isn't the best because I am using this site on my computer
clllaaaaaire:
any tips? the quality isn't the best because I am using this site on my computer
 Midnight97:
Kinda a roleplay story between me and my friend enjoy... Part one Forgive me for all the screenshots.
Midnight97:
Kinda a roleplay story between me and my friend enjoy... Part one Forgive me for all the screenshots.
 StevenisGhost:
what type of song should I make next, and will y'all go check out my new song on
Midnight97:
My drawing sure changed over the years look at these two pictures from 2024 to no
StevenisGhost:
what type of song should I make next, and will y'all go check out my new song on
Midnight97:
My drawing sure changed over the years look at these two pictures from 2024 to no
 EdwinJsHispanic:
"poem" love is So Beautiful to have. But it's so hard to have. At this point I don't know whether its worth the wait Or if it's just millions of miles to re
EdwinJsHispanic:
"poem" love is So Beautiful to have. But it's so hard to have. At this point I don't know whether its worth the wait Or if it's just millions of miles to re
EdwinJsHispanic:
"poem" love is So Beautiful to have. But it's so hard to have. At this point I don't know whether its worth the wait Or if it's just millions of miles to re
EdwinJsHispanic:
"poem" love is So Beautiful to have. But it's so hard to have. At this point I don't know whether its worth the wait Or if it's just millions of miles to re
 Breathless:
I don't know if this would be considered art, but its close enough I believe, Any
Breathless:
I don't know if this would be considered art, but its close enough I believe, Any