Ask
your own question, for FREE!
Earth Sciences
6 Online
 Allison:
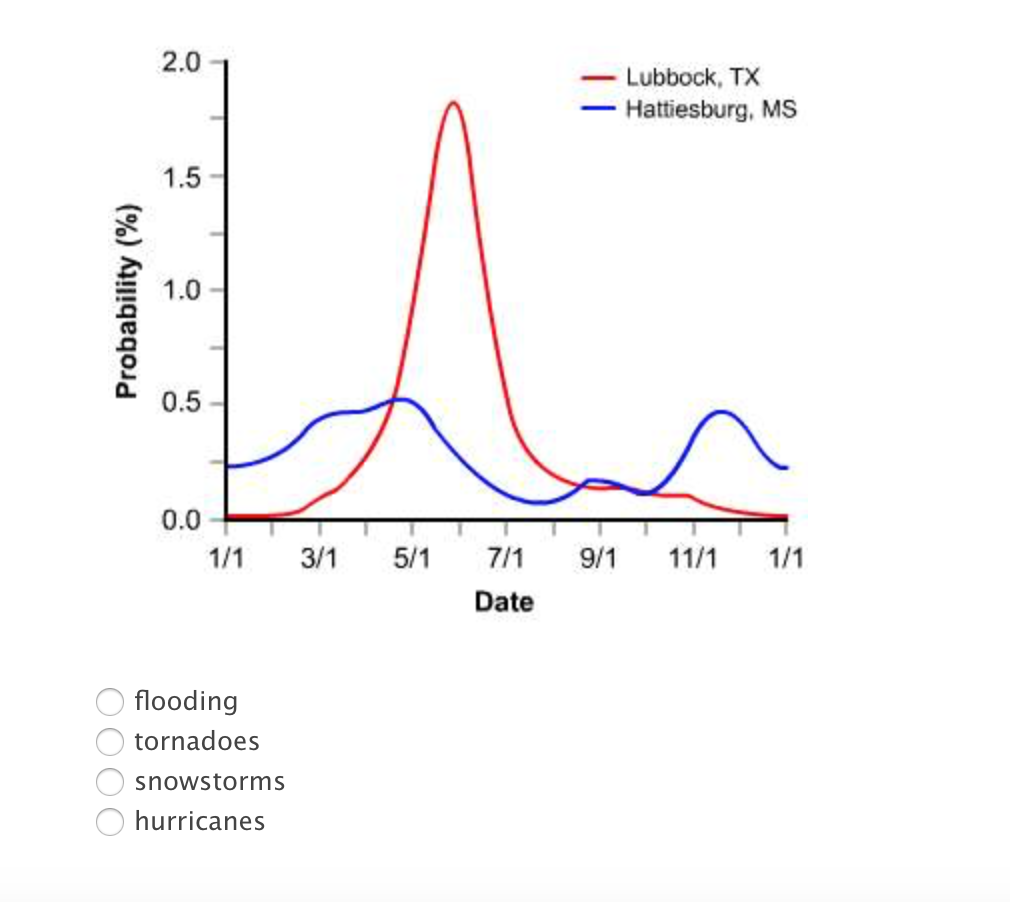
This graph represents the probability of a particular type of severe weather occuring in two cities over the course of 13 months. Think about the geographic location of each city and how the probability varies based on the time of year. Based on this information and what you have learned about severe weather in this unit, which severe weather is represented by the lines on the graph?
Still Need Help?
Join the QuestionCove community and study together with friends!
 Allison:
@AngeI
 AngeI:
This is a tough one, give me a minute please.
AngeI:
Ok, so snowstorm is out because snow doesnt come at July
AngeI:
I think it may be floods because floods normally occur between spring to fall. I am not sure yet though
Still Need Help?
Join the QuestionCove community and study together with friends!
Allison:
Wrong >.<
Can't find your answer?
Make a FREE account and ask your own questions, OR help others and earn volunteer hours!
Join our real-time social learning platform and learn together with your friends!
Join our real-time social learning platform and learn together with your friends!
Latest Questions
 Twaylor:
Time flies doesn't it? I tried to not be the second squeaky wheel of the household and ended up hurting myself and others severely.
Twaylor:
Time flies doesn't it? I tried to not be the second squeaky wheel of the household and ended up hurting myself and others severely.
 clllaaaaaire:
any tips? the quality isn't the best because I am using this site on my computer
clllaaaaaire:
any tips? the quality isn't the best because I am using this site on my computer
 Midnight97:
Kinda a roleplay story between me and my friend enjoy... Part one Forgive me for all the screenshots.
Midnight97:
Kinda a roleplay story between me and my friend enjoy... Part one Forgive me for all the screenshots.
 StevenisGhost:
what type of song should I make next, and will y'all go check out my new song on
Midnight97:
My drawing sure changed over the years look at these two pictures from 2024 to no
StevenisGhost:
what type of song should I make next, and will y'all go check out my new song on
Midnight97:
My drawing sure changed over the years look at these two pictures from 2024 to no
 EdwinJsHispanic:
"poem" love is So Beautiful to have. But it's so hard to have. At this point I don't know whether its worth the wait Or if it's just millions of miles to re
EdwinJsHispanic:
"poem" love is So Beautiful to have. But it's so hard to have. At this point I don't know whether its worth the wait Or if it's just millions of miles to re
EdwinJsHispanic:
"poem" love is So Beautiful to have. But it's so hard to have. At this point I don't know whether its worth the wait Or if it's just millions of miles to re
EdwinJsHispanic:
"poem" love is So Beautiful to have. But it's so hard to have. At this point I don't know whether its worth the wait Or if it's just millions of miles to re
 Twaylor:
Time flies doesn't it? I tried to not be the second squeaky wheel of the household and ended up hurting myself and others severely.
Twaylor:
Time flies doesn't it? I tried to not be the second squeaky wheel of the household and ended up hurting myself and others severely.
18 hours ago
12 Replies
2 Medals
clllaaaaaire:
any tips? the quality isn't the best because I am using this site on my computer
2 weeks ago
2 Replies
0 Medals
Midnight97:
Kinda a roleplay story between me and my friend enjoy... Part one Forgive me for all the screenshots.
2 weeks ago
2 Replies
1 Medal
StevenisGhost:
what type of song should I make next, and will y'all go check out my new song on
1 week ago
6 Replies
2 Medals
Midnight97:
My drawing sure changed over the years look at these two pictures from 2024 to no
2 weeks ago
6 Replies
1 Medal
EdwinJsHispanic:
"poem" love is So Beautiful to have. But it's so hard to have. At this point I don't know whether its worth the wait Or if it's just millions of miles to re
3 weeks ago
3 Replies
0 Medals
EdwinJsHispanic:
"poem" love is So Beautiful to have. But it's so hard to have. At this point I don't know whether its worth the wait Or if it's just millions of miles to re
3 weeks ago
0 Replies
0 Medals