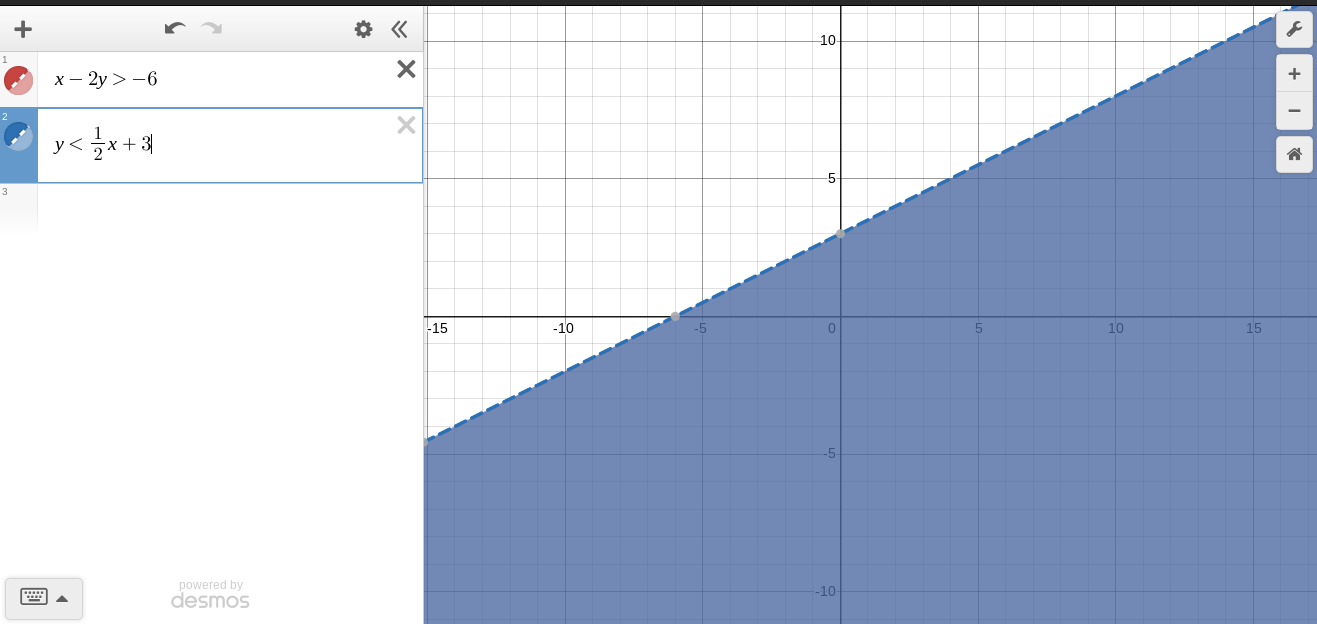
Which is the graph of the linear inequality x – 2y > –6?
 ramen:
Alright I'll take you through the steps. 1. Convert this equation into y=mx+b form where m=slope and b=y intercept. Do this by isolating y on a side by itself: Subtract the x on the left and put it on the right side to make -2y>-6-x. Then divide the whole equation by -2 to get y and only y on the left side making the equation y<1/2x+3. Note that the inequality has flipped around because we divided. 2. So we are given that the sign is a less than, which means that the line of the equation is dotted and shaded down. 3. Using the dotted and shaded down line, plot the point (0,3) because that is the y intercept given in the equation. Then the slope would be positive/going up because the slope is 1/2x. This means that from that point (0,3), the next point would be up 1 and right 2. Do this for all points.
 ramen:
Using the info, the graph should look like this ^^^^^^^ understand?
Join our real-time social learning platform and learn together with your friends!
 Twaylor:
Time flies doesn't it? I tried to not be the second squeaky wheel of the household and ended up hurting myself and others severely.
Twaylor:
Time flies doesn't it? I tried to not be the second squeaky wheel of the household and ended up hurting myself and others severely.
 clllaaaaaire:
any tips? the quality isn't the best because I am using this site on my computer
clllaaaaaire:
any tips? the quality isn't the best because I am using this site on my computer
 Midnight97:
Kinda a roleplay story between me and my friend enjoy... Part one Forgive me for all the screenshots.
Midnight97:
Kinda a roleplay story between me and my friend enjoy... Part one Forgive me for all the screenshots.
 StevenisGhost:
what type of song should I make next, and will y'all go check out my new song on
Midnight97:
My drawing sure changed over the years look at these two pictures from 2024 to no
StevenisGhost:
what type of song should I make next, and will y'all go check out my new song on
Midnight97:
My drawing sure changed over the years look at these two pictures from 2024 to no
 EdwinJsHispanic:
"poem" love is So Beautiful to have. But it's so hard to have. At this point I don't know whether its worth the wait Or if it's just millions of miles to re
EdwinJsHispanic:
"poem" love is So Beautiful to have. But it's so hard to have. At this point I don't know whether its worth the wait Or if it's just millions of miles to re
EdwinJsHispanic:
"poem" love is So Beautiful to have. But it's so hard to have. At this point I don't know whether its worth the wait Or if it's just millions of miles to re
EdwinJsHispanic:
"poem" love is So Beautiful to have. But it's so hard to have. At this point I don't know whether its worth the wait Or if it's just millions of miles to re
 Breathless:
I don't know if this would be considered art, but its close enough I believe, Any
Breathless:
I don't know if this would be considered art, but its close enough I believe, Any