Ask
your own question, for FREE!
Mathematics
7 Online
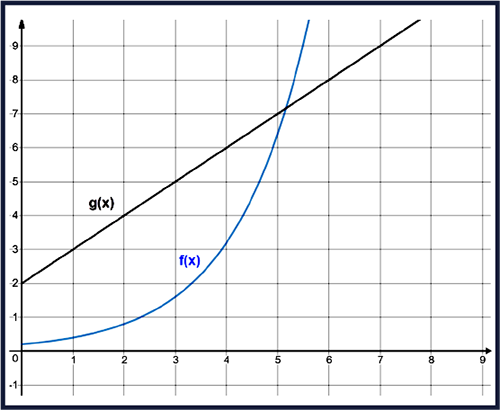
Two scientists are running experiments testing the effects of a vaccine on different control groups. The results are shown in the graph using the functions f(x) and g(x): graph of two functions in quadrant 1, f of x equals two tenths times two to the x power, and g of x equals x plus two Which statement best describes the graph of f(x) and g(x)? The graph of g(x) will eventually exceed the graph of f(x). The graph of f(x) will eventually exceed the graph of g(x). The graphs will both have their y-intercept equal to 5. The graphs will both have their y-intercept equal to 2.
Still Need Help?
Join the QuestionCove community and study together with friends!
 gabrielchestnut:
@Hero @darkknight @Vocaloid
gabrielchestnut:
they should be able to help
 jhonyy9:
please post this graph
Helpp plssssss
Can't find your answer?
Make a FREE account and ask your own questions, OR help others and earn volunteer hours!
Join our real-time social learning platform and learn together with your friends!
Join our real-time social learning platform and learn together with your friends!
Latest Questions
 avisshomes:
What should I look for before choosing a co-living space in Gurgaon?
avisshomes:
What should I look for before choosing a co-living space in Gurgaon?
 Twaylor:
Time flies doesn't it? I tried to not be the second squeaky wheel of the household and ended up hurting myself and others severely.
Twaylor:
Time flies doesn't it? I tried to not be the second squeaky wheel of the household and ended up hurting myself and others severely.
 clllaaaaaire:
any tips? the quality isn't the best because I am using this site on my computer
clllaaaaaire:
any tips? the quality isn't the best because I am using this site on my computer
 Midnight97:
Kinda a roleplay story between me and my friend enjoy... Part one Forgive me for all the screenshots.
Midnight97:
Kinda a roleplay story between me and my friend enjoy... Part one Forgive me for all the screenshots.
 StevenisGhost:
what type of song should I make next, and will y'all go check out my new song on
Midnight97:
My drawing sure changed over the years look at these two pictures from 2024 to no
StevenisGhost:
what type of song should I make next, and will y'all go check out my new song on
Midnight97:
My drawing sure changed over the years look at these two pictures from 2024 to no
 EdwinJsHispanic:
"poem" love is So Beautiful to have. But it's so hard to have. At this point I don't know whether its worth the wait Or if it's just millions of miles to re
EdwinJsHispanic:
"poem" love is So Beautiful to have. But it's so hard to have. At this point I don't know whether its worth the wait Or if it's just millions of miles to re
EdwinJsHispanic:
"poem" love is So Beautiful to have. But it's so hard to have. At this point I don't know whether its worth the wait Or if it's just millions of miles to re
EdwinJsHispanic:
"poem" love is So Beautiful to have. But it's so hard to have. At this point I don't know whether its worth the wait Or if it's just millions of miles to re
 Breathless:
I don't know if this would be considered art, but its close enough I believe, Any
Breathless:
I don't know if this would be considered art, but its close enough I believe, Any
2 hours ago
6 Replies
0 Medals
Twaylor:
Time flies doesn't it? I tried to not be the second squeaky wheel of the household and ended up hurting myself and others severely.
2 days ago
12 Replies
2 Medals
clllaaaaaire:
any tips? the quality isn't the best because I am using this site on my computer
2 weeks ago
2 Replies
0 Medals
Midnight97:
Kinda a roleplay story between me and my friend enjoy... Part one Forgive me for all the screenshots.
3 weeks ago
2 Replies
1 Medal
StevenisGhost:
what type of song should I make next, and will y'all go check out my new song on
1 week ago
6 Replies
2 Medals
Midnight97:
My drawing sure changed over the years look at these two pictures from 2024 to no
3 weeks ago
6 Replies
1 Medal
EdwinJsHispanic:
"poem" love is So Beautiful to have. But it's so hard to have. At this point I don't know whether its worth the wait Or if it's just millions of miles to re
3 weeks ago
3 Replies
0 Medals
EdwinJsHispanic:
"poem" love is So Beautiful to have. But it's so hard to have. At this point I don't know whether its worth the wait Or if it's just millions of miles to re
3 weeks ago
0 Replies
0 Medals
Breathless:
I don't know if this would be considered art, but its close enough I believe, Any
4 weeks ago
3 Replies
0 Medals