Ask
your own question, for FREE!
Statistics
6 Online
Explain how you use a two-way frequency table to find possible associations and trends in data?
Still Need Help?
Join the QuestionCove community and study together with friends!
 dude:
dude:
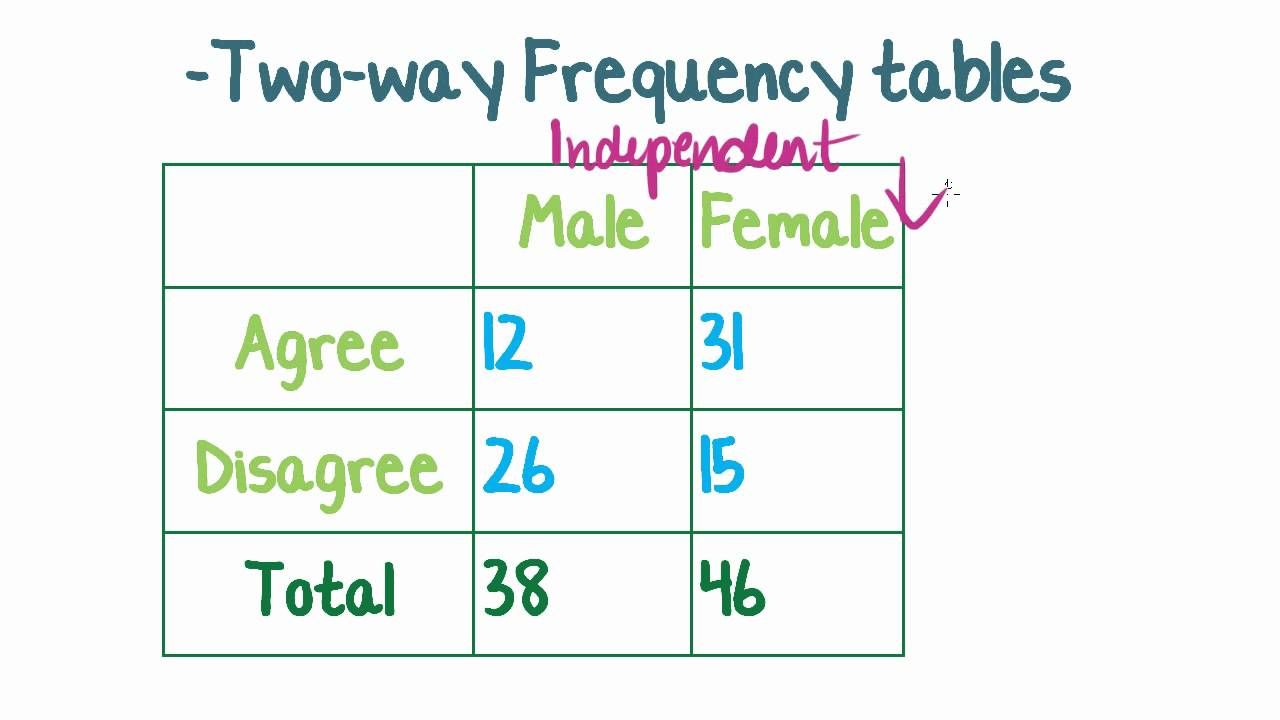
Frequency tables tell you how much/often something occurs. In the context of a two-way frequency table you can compare how often one variable went against another. In the image below, you can tell that most males disagree while most females agree. (Contrasting between each) *Friendly reminder that this is my work, please do not copy-paste my work.*
Can't find your answer?
Make a FREE account and ask your own questions, OR help others and earn volunteer hours!
Join our real-time social learning platform and learn together with your friends!
Join our real-time social learning platform and learn together with your friends!
Latest Questions
 Strawberryluna:
Read my poem. Im not for criticism its a poem I wrote after my breakup: Youu2019ll never understand the way you made me break, I hate that I still love you
Strawberryluna:
Read my poem. Im not for criticism its a poem I wrote after my breakup: Youu2019ll never understand the way you made me break, I hate that I still love you
 Bounty:
first poem in a min- (tittle)? one moment i'm fine I smile till my face burns I laugh till I cant breath Then I cry I wonder where I went wrong I listen to
Bounty:
first poem in a min- (tittle)? one moment i'm fine I smile till my face burns I laugh till I cant breath Then I cry I wonder where I went wrong I listen to
 Twaylor:
3d printing a glider (for 150 pound 5'8 person - prolly should make it for up to
Twaylor:
3d printing a glider (for 150 pound 5'8 person - prolly should make it for up to
 cullenn:
pitter patter sound of rain gently tapping my window tonight. calming, soothing, right? not for me.
cullenn:
pitter patter sound of rain gently tapping my window tonight. calming, soothing, right? not for me.
 Arriyanalol:
DON'T BUY TICKETS TO SEAWORLD i watched a documentary on seaworld and its sad wha
Arriyanalol:
DON'T BUY TICKETS TO SEAWORLD i watched a documentary on seaworld and its sad wha
 natalieee:
who else wants a job in biology? I love biomedical science and want to work with
Twaylor:
Time flies doesn't it? I tried to not be the second squeaky wheel of the household and ended up hurting myself and others severely.
natalieee:
who else wants a job in biology? I love biomedical science and want to work with
Twaylor:
Time flies doesn't it? I tried to not be the second squeaky wheel of the household and ended up hurting myself and others severely.
 clllaaaaaire:
any tips? the quality isn't the best because I am using this site on my computer
clllaaaaaire:
any tips? the quality isn't the best because I am using this site on my computer
Strawberryluna:
Read my poem. Im not for criticism its a poem I wrote after my breakup: Youu2019ll never understand the way you made me break, I hate that I still love you
1 hour ago
1 Reply
0 Medals
Bounty:
first poem in a min- (tittle)? one moment i'm fine I smile till my face burns I laugh till I cant breath Then I cry I wonder where I went wrong I listen to
1 day ago
5 Replies
1 Medal
Twaylor:
3d printing a glider (for 150 pound 5'8 person - prolly should make it for up to
2 days ago
5 Replies
0 Medals
cullenn:
pitter patter sound of rain gently tapping my window tonight. calming, soothing, right? not for me.
2 days ago
2 Replies
0 Medals
 Arriyanalol:
DON'T BUY TICKETS TO SEAWORLD i watched a documentary on seaworld and its sad wha
Arriyanalol:
DON'T BUY TICKETS TO SEAWORLD i watched a documentary on seaworld and its sad wha
2 weeks ago
2 Replies
1 Medal
natalieee:
who else wants a job in biology? I love biomedical science and want to work with
2 weeks ago
9 Replies
0 Medals
Twaylor:
Time flies doesn't it? I tried to not be the second squeaky wheel of the household and ended up hurting myself and others severely.
3 weeks ago
12 Replies
2 Medals
clllaaaaaire:
any tips? the quality isn't the best because I am using this site on my computer
1 month ago
2 Replies
0 Medals