 AnnabelleHernandez:
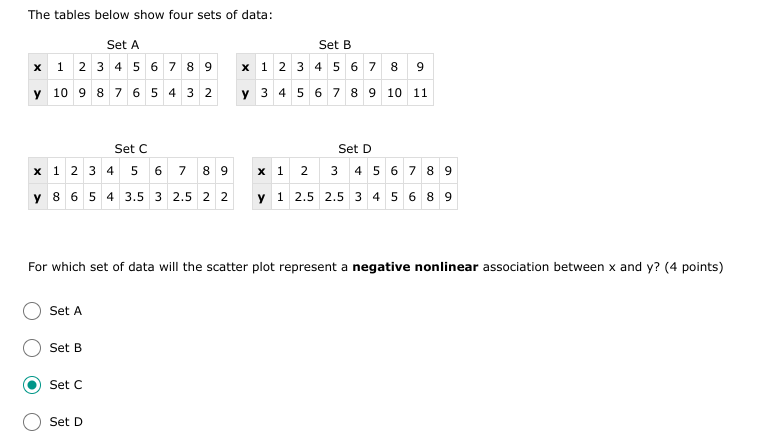
The tables below show four sets of data: Set A x 1 2 3 4 5 6 7 8 9 y 10 9 8 7 6 5 4 3 2 Set B x 1 2 3 4 5 6 7 8 9 y 3 4 5 6 7 8 9 10 11 Set C x 1 2 3 4 5 6 7 8 9 y 8 6 5 4 3.5 3 2.5 2 2 Set D x 1 2 3 4 5 6 7 8 9 y 1 2.5 2.5 3 4 5 6 8 9 For which set of data will the scatter plot represent a negative nonlinear association between x and y? (4 points) Set A Set B Set C Set D
 supie:
Can you post a screenshot so we can better understand?
AnnabelleHernandez:
ok
 darkknight:
SS posted @supie feel free to continue
supie:
\(\color{#0cbb34}{\text{Originally Posted by}}\) @darkknight SS posted @supie feel free to continue \(\color{#0cbb34}{\text{End of Quote}}\) Actually, I said so " `we` can better understand" not meaning I was going to answer the question; the table thing was just hard to read.
darkknight:
well then, ill be happy to take over, graph out each situation by plotting out all the points, a negative trendline will be that the slope is negative, and non-linear means not in a straight line. Hope this helped
supie:
Thanks Darkknight.
darkknight:
np, keep it up
 jhonyy9:
\(\color{#0cbb34}{\text{Originally Posted by}}\) @darkknight well then, ill be happy to take over, graph out each situation by plotting out all the points, a negative trendline will be that the slope is negative, and non-linear means not in a straight line. Hope this helped \(\color{#0cbb34}{\text{End of Quote}}\) explained in a good way - congrats @darkknight
darkknight:
mhm, ty @jhonyy9
Join our real-time social learning platform and learn together with your friends!
 Twaylor:
Time flies doesn't it? I tried to not be the second squeaky wheel of the household and ended up hurting myself and others severely.
Twaylor:
Time flies doesn't it? I tried to not be the second squeaky wheel of the household and ended up hurting myself and others severely.
 clllaaaaaire:
any tips? the quality isn't the best because I am using this site on my computer
clllaaaaaire:
any tips? the quality isn't the best because I am using this site on my computer
 Midnight97:
Kinda a roleplay story between me and my friend enjoy... Part one Forgive me for all the screenshots.
Midnight97:
Kinda a roleplay story between me and my friend enjoy... Part one Forgive me for all the screenshots.
 StevenisGhost:
what type of song should I make next, and will y'all go check out my new song on
Midnight97:
My drawing sure changed over the years look at these two pictures from 2024 to no
StevenisGhost:
what type of song should I make next, and will y'all go check out my new song on
Midnight97:
My drawing sure changed over the years look at these two pictures from 2024 to no
 EdwinJsHispanic:
"poem" love is So Beautiful to have. But it's so hard to have. At this point I don't know whether its worth the wait Or if it's just millions of miles to re
EdwinJsHispanic:
"poem" love is So Beautiful to have. But it's so hard to have. At this point I don't know whether its worth the wait Or if it's just millions of miles to re
EdwinJsHispanic:
"poem" love is So Beautiful to have. But it's so hard to have. At this point I don't know whether its worth the wait Or if it's just millions of miles to re
EdwinJsHispanic:
"poem" love is So Beautiful to have. But it's so hard to have. At this point I don't know whether its worth the wait Or if it's just millions of miles to re
 Breathless:
I don't know if this would be considered art, but its close enough I believe, Any
Breathless:
I don't know if this would be considered art, but its close enough I believe, Any