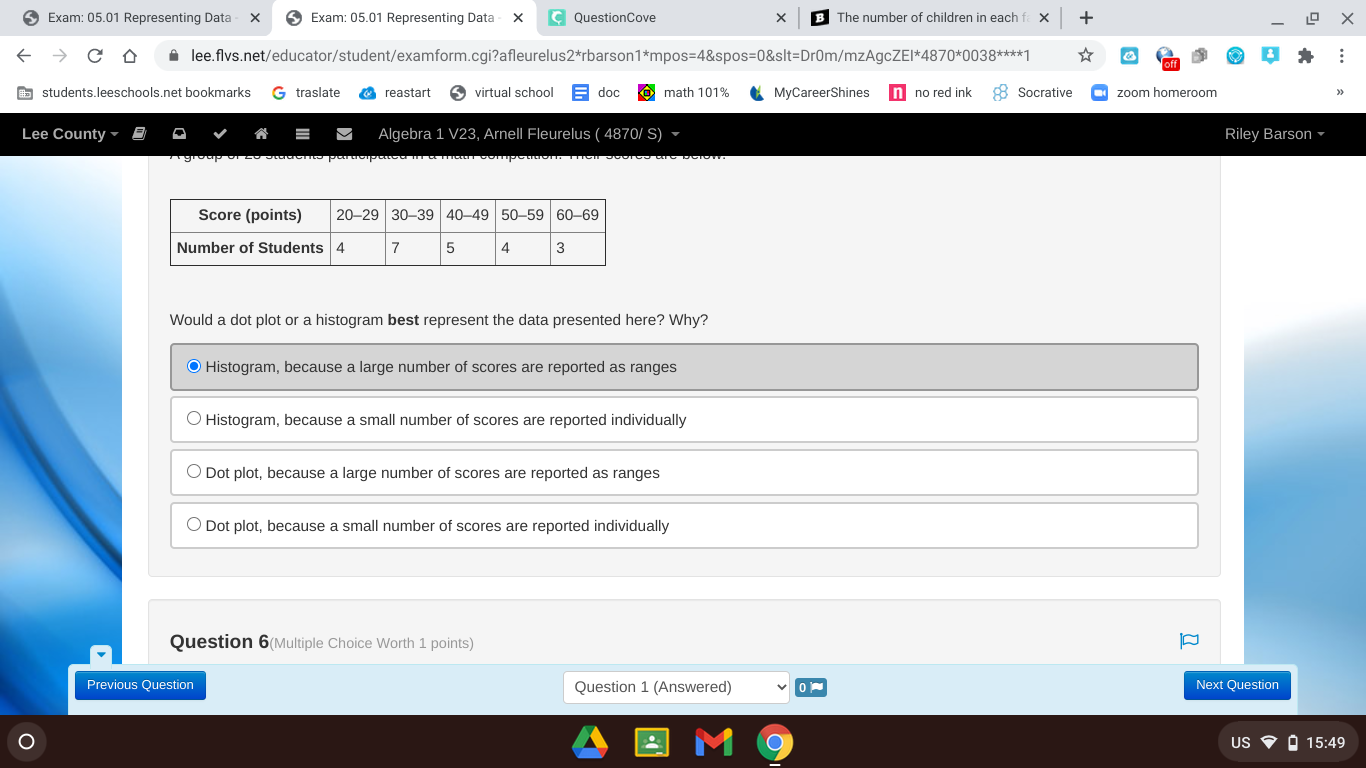
A group of 23 students participated in a math competition. Their scores are below: Score (points) 20–29 30–39 40–49 50–59 60–69 Number of Students 4 7 5 4 3 Would a dot plot or a histogram best represent the data presented here? Why? Histogram, because a large number of scores are reported as ranges Histogram, because a small number of scores are reported individually Dot plot, because a large number of scores are reported as ranges Dot plot, because a small number of scores are reported individually
 lilaspie7:
Its either A or B cuz this data cannot go on a dot plot as dot plots only go on 1 number. A histogram could list a set of ranges and also largeer numbers are used in this data. so which is it? a or b?
i dunno that's why I asked
lilaspie7:
is there a large set of numbers or a small set of numbers?
oh there it is
lilaspie7:
If you think its A go for it. Btw welcome to qc.
1 I would like to be sure and 2 thanks it seems like a cool place to cheat on you exams and what not
Join our real-time social learning platform and learn together with your friends!
 Twaylor:
Time flies doesn't it? I tried to not be the second squeaky wheel of the household and ended up hurting myself and others severely.
Twaylor:
Time flies doesn't it? I tried to not be the second squeaky wheel of the household and ended up hurting myself and others severely.
 clllaaaaaire:
any tips? the quality isn't the best because I am using this site on my computer
clllaaaaaire:
any tips? the quality isn't the best because I am using this site on my computer
 Midnight97:
Kinda a roleplay story between me and my friend enjoy... Part one Forgive me for all the screenshots.
Midnight97:
Kinda a roleplay story between me and my friend enjoy... Part one Forgive me for all the screenshots.
 StevenisGhost:
what type of song should I make next, and will y'all go check out my new song on
Midnight97:
My drawing sure changed over the years look at these two pictures from 2024 to no
StevenisGhost:
what type of song should I make next, and will y'all go check out my new song on
Midnight97:
My drawing sure changed over the years look at these two pictures from 2024 to no
 EdwinJsHispanic:
"poem" love is So Beautiful to have. But it's so hard to have. At this point I don't know whether its worth the wait Or if it's just millions of miles to re
EdwinJsHispanic:
"poem" love is So Beautiful to have. But it's so hard to have. At this point I don't know whether its worth the wait Or if it's just millions of miles to re
EdwinJsHispanic:
"poem" love is So Beautiful to have. But it's so hard to have. At this point I don't know whether its worth the wait Or if it's just millions of miles to re
EdwinJsHispanic:
"poem" love is So Beautiful to have. But it's so hard to have. At this point I don't know whether its worth the wait Or if it's just millions of miles to re
 Breathless:
I don't know if this would be considered art, but its close enough I believe, Any
Breathless:
I don't know if this would be considered art, but its close enough I believe, Any