 TETSXPREME:
help o;
 Timmyspu:
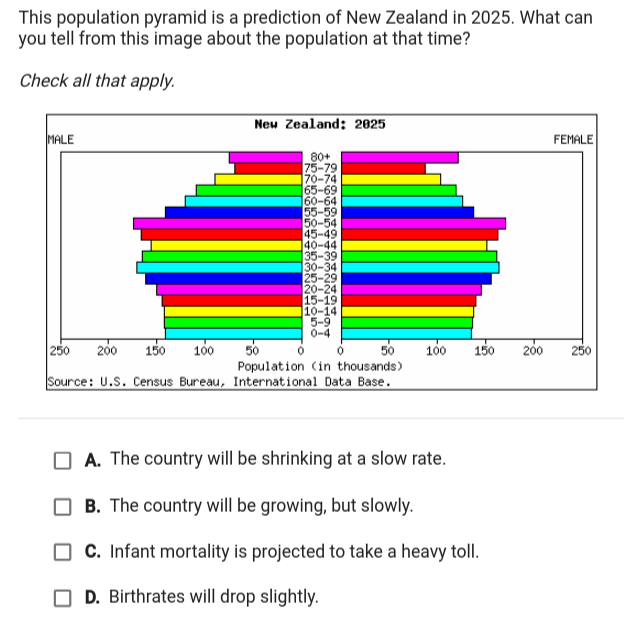
Ok, so what is this chart trying to tell you?
 TETSXPREME:
ion get it
 AZ:
AZ:
/sigh
AZ:
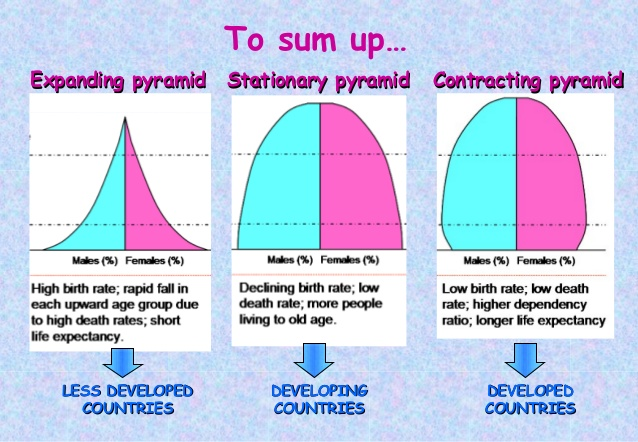
Take a look at my image. Do you see the first image. It's a pyramid. There's a whole bunch of young people and not so many old people. What do young people do? They have kids. So that means you have a high birth rate and you know how populations increase exponentially? Because 2 people can have 3 kids. And then each of those kids will have more kids and so in like 100 years you went from 2 people to so many people from those 2 people
AZ:
following along still?
TETSXPREME:
ion get it
AZ:
do you ever get anything?
AZ:
or is that the only thing you can say .-.
TETSXPREME:
if people have high baby rates then alot of ppl was sleepin together then
AZ:
okay so now look at the image in the middle do you see that it says birth rate is declining? now look at the last image do you see that there is LESS younger people than older people? that means less babies so what does that mean as time goes along? is the population going to increase or decrease?
TETSXPREME:
i dont know how to read this stuff
AZ:
just read what I'm writing to you there's less young people they have fewer kids does that mean the population will increase or decrease?
TETSXPREME:
decrease
AZ:
good and when people are having fewer kids, is the birthrate increasing or decreasing?
TETSXPREME:
decreasing
AZ:
Good!! We're making progress now, Tet
AZ:
Now look at your answer choices. Remember there's more than one correct answer choice What do you think it is?
TETSXPREME:
D ?
AZ:
That's one of them! But there's one more ;o
AZ:
will the country's population be growing or shrinking if they have a decreasing birthrate
TETSXPREME:
A?
AZ:
and there you have it!
TETSXPREME:
tysm C:
AZ:
you're welcome c:
Join our real-time social learning platform and learn together with your friends!
 Twaylor:
Time flies doesn't it? I tried to not be the second squeaky wheel of the household and ended up hurting myself and others severely.
Twaylor:
Time flies doesn't it? I tried to not be the second squeaky wheel of the household and ended up hurting myself and others severely.
 clllaaaaaire:
any tips? the quality isn't the best because I am using this site on my computer
clllaaaaaire:
any tips? the quality isn't the best because I am using this site on my computer
 Midnight97:
Kinda a roleplay story between me and my friend enjoy... Part one Forgive me for all the screenshots.
Midnight97:
Kinda a roleplay story between me and my friend enjoy... Part one Forgive me for all the screenshots.
 StevenisGhost:
what type of song should I make next, and will y'all go check out my new song on
Midnight97:
My drawing sure changed over the years look at these two pictures from 2024 to no
StevenisGhost:
what type of song should I make next, and will y'all go check out my new song on
Midnight97:
My drawing sure changed over the years look at these two pictures from 2024 to no
 EdwinJsHispanic:
"poem" love is So Beautiful to have. But it's so hard to have. At this point I don't know whether its worth the wait Or if it's just millions of miles to re
EdwinJsHispanic:
"poem" love is So Beautiful to have. But it's so hard to have. At this point I don't know whether its worth the wait Or if it's just millions of miles to re
EdwinJsHispanic:
"poem" love is So Beautiful to have. But it's so hard to have. At this point I don't know whether its worth the wait Or if it's just millions of miles to re
EdwinJsHispanic:
"poem" love is So Beautiful to have. But it's so hard to have. At this point I don't know whether its worth the wait Or if it's just millions of miles to re
 Breathless:
I don't know if this would be considered art, but its close enough I believe, Any
Breathless:
I don't know if this would be considered art, but its close enough I believe, Any