 artlover03:
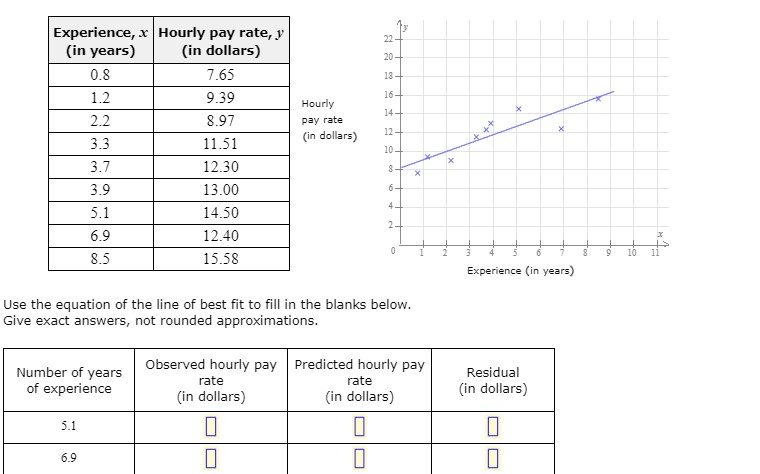
hey so the question is going to be posted, but im going to post a second question. It will have a red marking on it, I was wondering if you could check my work! 😊 part of the first question: The table and scatter plot show the number of years of experience, , and the hourly pay rate, , for each of cashiers in Texas. The equation of the line of best fit is y= 0.9x+8.13
 AZ:
AZ:
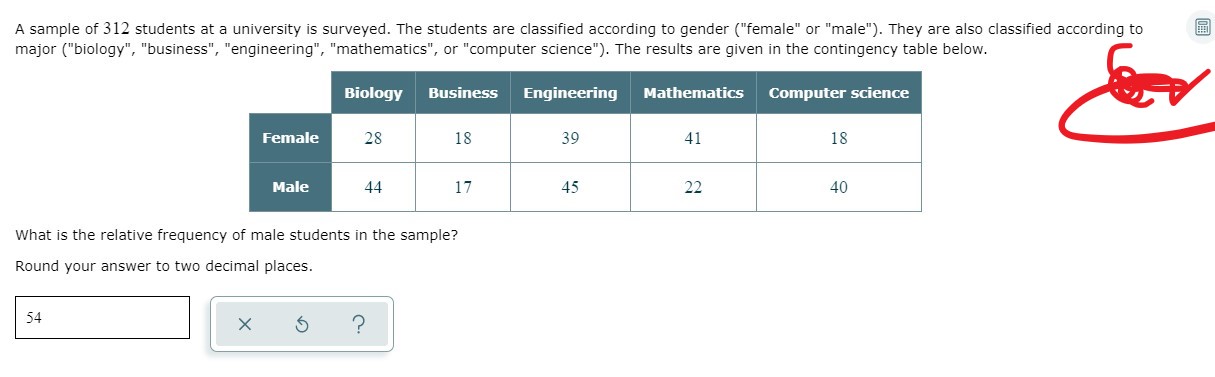
Second image- it says round to 2 decimal places. So you're on the right track but you need to have 2 decimal places
artlover03:
\(\color{#0cbb34}{\text{Originally Posted by}}\) @AZ Second image- it says round to 2 decimal places. So you're on the right track but you need to have 2 decimal places \(\color{#0cbb34}{\text{End of Quote}}\) yayyyyy!
AZ:
so do all the math again but don't round the number to the nearest whole number. You need to keep 2 decimal places (44+17+45+22+40) / 312 * 100
AZ:
But anyway, for your first question Did they give you the line of best fit? (Not sure if there's something you forgot to include in the screenshot) Unless you're expected to find the line of best fit yourself? Since they say "give exact answers, not rounded approximations"
AZ:
So for your first question under the "Observed hourly pay" you take the numbers from your table so in your table where it says 5.1 and 6.9, those are your values the next "Predicted hourly pay" I'm still waiting on you to get back to me if they already provided you with the line of best fit the final "residual" column is residual = predicted - observed so you just subtract the numbers from the other columns
Join our real-time social learning platform and learn together with your friends!
 Twaylor:
Time flies doesn't it? I tried to not be the second squeaky wheel of the household and ended up hurting myself and others severely.
Twaylor:
Time flies doesn't it? I tried to not be the second squeaky wheel of the household and ended up hurting myself and others severely.
 clllaaaaaire:
any tips? the quality isn't the best because I am using this site on my computer
clllaaaaaire:
any tips? the quality isn't the best because I am using this site on my computer
 Midnight97:
Kinda a roleplay story between me and my friend enjoy... Part one Forgive me for all the screenshots.
Midnight97:
Kinda a roleplay story between me and my friend enjoy... Part one Forgive me for all the screenshots.
 StevenisGhost:
what type of song should I make next, and will y'all go check out my new song on
Midnight97:
My drawing sure changed over the years look at these two pictures from 2024 to no
StevenisGhost:
what type of song should I make next, and will y'all go check out my new song on
Midnight97:
My drawing sure changed over the years look at these two pictures from 2024 to no
 EdwinJsHispanic:
"poem" love is So Beautiful to have. But it's so hard to have. At this point I don't know whether its worth the wait Or if it's just millions of miles to re
EdwinJsHispanic:
"poem" love is So Beautiful to have. But it's so hard to have. At this point I don't know whether its worth the wait Or if it's just millions of miles to re
EdwinJsHispanic:
"poem" love is So Beautiful to have. But it's so hard to have. At this point I don't know whether its worth the wait Or if it's just millions of miles to re
EdwinJsHispanic:
"poem" love is So Beautiful to have. But it's so hard to have. At this point I don't know whether its worth the wait Or if it's just millions of miles to re
 Breathless:
I don't know if this would be considered art, but its close enough I believe, Any
Breathless:
I don't know if this would be considered art, but its close enough I believe, Any