 deathscarewolf:
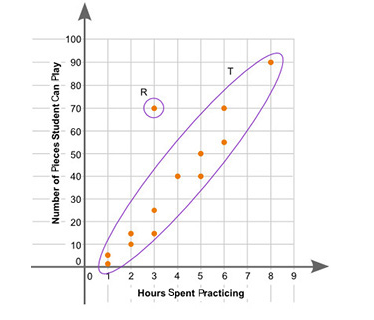
The scatter plot shows the relationship between the number of hours spent practicing piano per week and the number of pieces of music the student can play: (will be in comments) Part A: What is the group of points labeled T called? What is the point labeled R called? Give a possible reason for the presence of point R. Part B: Describe the association between the number of hours practiced each week and the number of pieces a piano student can play.
 deathscarewolf:
@AZ
 AZ:
AZ:
So when you have a scatter plot, you're going to have points on a graph If the points are all close to each other, they're called clusters If there are points that are far away from the rest, those are your outliers Think of outliers as your outcasts They're going to be away from the clusters so for part A what is the group of points labeled T called? What is the point labeled R called? Which one is a cluster and which one is an outlier
deathscarewolf:
t cluster and r's outlier?
AZ:
You got it!
deathscarewolf:
ok then part b?
AZ:
we haven't finished part A) "Give a possible reason for the presence of point R." you can explain there's a student who didn't practice much but can still play a lot of pieces
AZ:
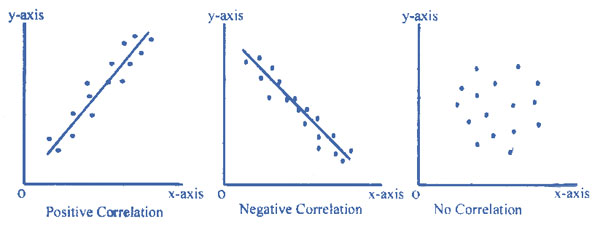
For part B does the graph in your question look like a positive association or negative association?
Join our real-time social learning platform and learn together with your friends!
 Strawberryluna:
Read my poem. Im not for criticism its a poem I wrote after my breakup: Youu2019ll never understand the way you made me break, I hate that I still love you
Strawberryluna:
Read my poem. Im not for criticism its a poem I wrote after my breakup: Youu2019ll never understand the way you made me break, I hate that I still love you
 Bounty:
first poem in a min- (tittle)? one moment i'm fine I smile till my face burns I laugh till I cant breath Then I cry I wonder where I went wrong I listen to
Bounty:
first poem in a min- (tittle)? one moment i'm fine I smile till my face burns I laugh till I cant breath Then I cry I wonder where I went wrong I listen to
 Twaylor:
3d printing a glider (for 150 pound 5'8 person - prolly should make it for up to
Twaylor:
3d printing a glider (for 150 pound 5'8 person - prolly should make it for up to
 cullenn:
pitter patter sound of rain gently tapping my window tonight. calming, soothing, right? not for me.
cullenn:
pitter patter sound of rain gently tapping my window tonight. calming, soothing, right? not for me.

 Arriyanalol:
DON'T BUY TICKETS TO SEAWORLD i watched a documentary on seaworld and its sad wha
Arriyanalol:
DON'T BUY TICKETS TO SEAWORLD i watched a documentary on seaworld and its sad wha
 natalieee:
who else wants a job in biology? I love biomedical science and want to work with
Twaylor:
Time flies doesn't it? I tried to not be the second squeaky wheel of the household and ended up hurting myself and others severely.
natalieee:
who else wants a job in biology? I love biomedical science and want to work with
Twaylor:
Time flies doesn't it? I tried to not be the second squeaky wheel of the household and ended up hurting myself and others severely.
 clllaaaaaire:
any tips? the quality isn't the best because I am using this site on my computer
clllaaaaaire:
any tips? the quality isn't the best because I am using this site on my computer