 deathscarewolf:
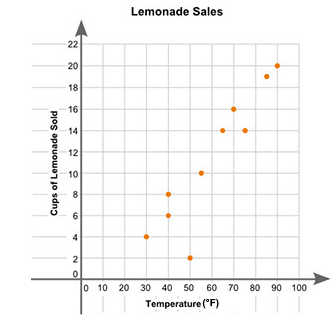
Eric plotted the graph below to show the relationship between the temperature of his city and the number of cups of lemonade he sold daily: (in comments) Part A: Describe the relationship between the temperature of the city and the number of cups of lemonade sold. Part B: Describe how you can make the line of best fit. Write the approximate slope and y-intercept of the line of best fit. Show your work, including the points that you use to calculate the slope and y-intercept.
 snowflake0531:
Let's first do Part A, Describe the relationship between the temperature of the city and the number of cups of lemonade sold. this should be obvious, seeing as when the temperature grows, the amount of lemonade sold also grows
deathscarewolf:
ya i could see that
snowflake0531:
Okay, for line of best fit, you can see that the line is kinda right there, going through the points (30,4)and (90,2) Can you figure out the slope?
deathscarewolf:
(50,2)?
snowflake0531:
The slope, do you know the slope thingy? how to find it between 2 points?
deathscarewolf:
kinda forgot
 AZ:
AZ:
\(\Large\text{Slope} = \dfrac{\color{green}{y_2} - \color{orange}{y_1}}{\color{cyan}{x_2}-\color{red}{x_1}}\) where you have two points \(\Large (\color{red}{x_1}, \color{orange}{y_1})\) and \(\Large (\color{cyan}{x_2}, \color{green}{y_2})\) So your two points are \((\color{red}{30}, \color{orange}{4})\) and \((\color{cyan}{90}, \color{green}{20})\)
snowflake0531:
So can you use ^^^^^^^ and find the slope between teh two points?
deathscarewolf:
idk to be honest xD
snowflake0531:
We do (20-4)/(90-30) can you simplify that?
deathscarewolf:
(16,60)?
snowflake0531:
The slope isn't a point, it's a number In this case, 16/60, which is simplified to 4/15
deathscarewolf:
before i did both and got 0.26667
snowflake0531:
YOu want exact form, so you don't convert it into a fraction, it stays at 4/15
deathscarewolf:
ok
snowflake0531:
So now we want to figure out the y-intercept So we take the slope and a coordinate point 4=4/15(30) + b 4 = 8+b b=-4
snowflake0531:
So, we have \[y=\frac{ 4 }{ 15 } x -4\]
deathscarewolf:
ok
snowflake0531:
so there's your answer.-.
deathscarewolf:
ty
snowflake0531:
yw..
Join our real-time social learning platform and learn together with your friends!
 Twaylor:
Time flies doesn't it? I tried to not be the second squeaky wheel of the household and ended up hurting myself and others severely.
Twaylor:
Time flies doesn't it? I tried to not be the second squeaky wheel of the household and ended up hurting myself and others severely.
 clllaaaaaire:
any tips? the quality isn't the best because I am using this site on my computer
clllaaaaaire:
any tips? the quality isn't the best because I am using this site on my computer
 Midnight97:
Kinda a roleplay story between me and my friend enjoy... Part one Forgive me for all the screenshots.
Midnight97:
Kinda a roleplay story between me and my friend enjoy... Part one Forgive me for all the screenshots.
 StevenisGhost:
what type of song should I make next, and will y'all go check out my new song on
Midnight97:
My drawing sure changed over the years look at these two pictures from 2024 to no
StevenisGhost:
what type of song should I make next, and will y'all go check out my new song on
Midnight97:
My drawing sure changed over the years look at these two pictures from 2024 to no
 EdwinJsHispanic:
"poem" love is So Beautiful to have. But it's so hard to have. At this point I don't know whether its worth the wait Or if it's just millions of miles to re
EdwinJsHispanic:
"poem" love is So Beautiful to have. But it's so hard to have. At this point I don't know whether its worth the wait Or if it's just millions of miles to re
EdwinJsHispanic:
"poem" love is So Beautiful to have. But it's so hard to have. At this point I don't know whether its worth the wait Or if it's just millions of miles to re
EdwinJsHispanic:
"poem" love is So Beautiful to have. But it's so hard to have. At this point I don't know whether its worth the wait Or if it's just millions of miles to re
 Breathless:
I don't know if this would be considered art, but its close enough I believe, Any
Breathless:
I don't know if this would be considered art, but its close enough I believe, Any