 TETSXPREME:
@AZ
 jas2024:
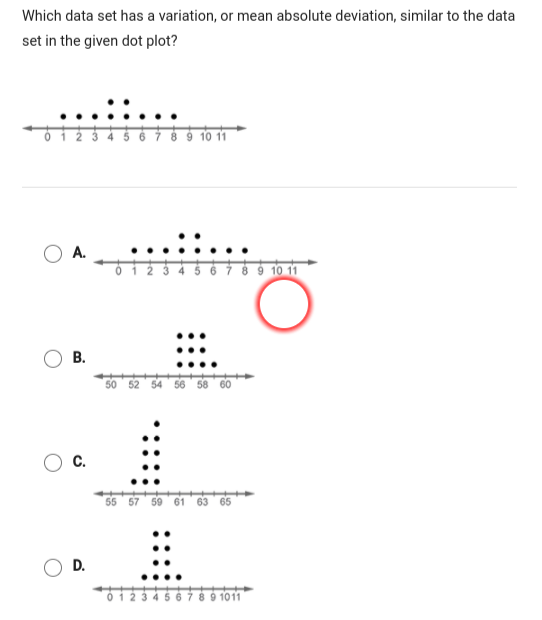
Do you know how to find the mean ?
TETSXPREME:
nope
jas2024:
ok to find the mean, you add up all the numbers and divide the answer by however many numbers there are .
jas2024:
so for the given plot, you have 1+2+3+4+4+5+5+6+7+8=
TETSXPREME:
45
jas2024:
now divide it by 10 (the amount of numbers yu added up)
TETSXPREME:
4 remainder 5
jas2024:
or just 4.5 but yes . so do the same thing with the other 4 plots. Which one equals 4.5 ?
 AZ:
AZ:
This question is asking about the mean absolute deviation, not the mean Remember that long formula we had to use the other day? You'd basically have to do that for each answer choice and see which one has a similar MAD
AZ:
or you can just take a look at the graphs, which graph looks exactly the same as the question? That one is going to have the same mean absolute deviation because all the data values are in the same relationship to each other so it deviates the same amount from the mean
TETSXPREME:
i think the answer is A. for this one e.e
AZ:
You got it It has the same numbers but just because the numbers are all spread out in the same way so it's going to have the exact same MAD
TETSXPREME:
i dont know how to use that calculator tho e.e
AZ:
okay so to use that calculator, all you have to do is count the value of each dot so for example there is only one dot on top of 1, 2, 3 and then there's two on top of 4 and 5 and one dot on top of 6, 7, 8 so your list of numbers is 1, 2, 3, 4, 4, 5, 5, 6, 7, 8 and you just enter that into http://www.alcula.com/calculators/statistics/mean-absolute-deviation/
AZ:
and it's the same idea for all of the answer choices just count how many dots are on top of that number and that's how many times that number is in the list
Join our real-time social learning platform and learn together with your friends!
 Twaylor:
Time flies doesn't it? I tried to not be the second squeaky wheel of the household and ended up hurting myself and others severely.
Twaylor:
Time flies doesn't it? I tried to not be the second squeaky wheel of the household and ended up hurting myself and others severely.
 clllaaaaaire:
any tips? the quality isn't the best because I am using this site on my computer
clllaaaaaire:
any tips? the quality isn't the best because I am using this site on my computer
 Midnight97:
Kinda a roleplay story between me and my friend enjoy... Part one Forgive me for all the screenshots.
Midnight97:
Kinda a roleplay story between me and my friend enjoy... Part one Forgive me for all the screenshots.
 StevenisGhost:
what type of song should I make next, and will y'all go check out my new song on
Midnight97:
My drawing sure changed over the years look at these two pictures from 2024 to no
StevenisGhost:
what type of song should I make next, and will y'all go check out my new song on
Midnight97:
My drawing sure changed over the years look at these two pictures from 2024 to no
 EdwinJsHispanic:
"poem" love is So Beautiful to have. But it's so hard to have. At this point I don't know whether its worth the wait Or if it's just millions of miles to re
EdwinJsHispanic:
"poem" love is So Beautiful to have. But it's so hard to have. At this point I don't know whether its worth the wait Or if it's just millions of miles to re
EdwinJsHispanic:
"poem" love is So Beautiful to have. But it's so hard to have. At this point I don't know whether its worth the wait Or if it's just millions of miles to re
EdwinJsHispanic:
"poem" love is So Beautiful to have. But it's so hard to have. At this point I don't know whether its worth the wait Or if it's just millions of miles to re
 Breathless:
I don't know if this would be considered art, but its close enough I believe, Any
Breathless:
I don't know if this would be considered art, but its close enough I believe, Any