 unoreverse:
how do I understand a stem and leaf plot.
 bri05:
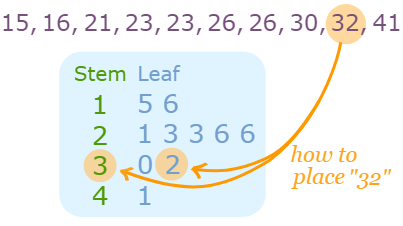
via goggle- A Stem and Leaf Plot is a special table where each data value is split into a "stem" (the first digit or digits) and a "leaf" (usually the last digit). Like in this example: "32" is split into "3" (stem) and "2" (leaf). The "stem" values are listed down, and the "leaf" values go right (or left) from the stem values.
 AZ:
AZ:
There's not much to understanding a stem and leaf plot Let's say you have the number 147, 43, 142, 46 Your stem is the first digit in your number so in \(\color{red}{1}47\), the 1 is your stem and in \(\color{red}{4}3\), the 4 is your stem and in \(\color{red}{1}42\), the 1 is your stem and in \(\color{red}{4}6\), the 4 is your stem that means the rest of the numbers is your LEAF and so you create the table like this |dw:1618397726557:dw|
 Joe348:
Basically the left side is the stem and its controls the first digit while the other side is the leaf which controls last digit. Example: 5|348
 payton:
A stem-and-leaf display or stem-and-leaf plot is a device for presenting quantitative data in a graphical format, similar to a histogram, to assist in visualizing the shape of a distribution. -google search
Join our real-time social learning platform and learn together with your friends!
 Strawberryluna:
Read my poem. Im not for criticism its a poem I wrote after my breakup: Youu2019ll never understand the way you made me break, I hate that I still love you
Strawberryluna:
Read my poem. Im not for criticism its a poem I wrote after my breakup: Youu2019ll never understand the way you made me break, I hate that I still love you
 Bounty:
first poem in a min- (tittle)? one moment i'm fine I smile till my face burns I laugh till I cant breath Then I cry I wonder where I went wrong I listen to
Bounty:
first poem in a min- (tittle)? one moment i'm fine I smile till my face burns I laugh till I cant breath Then I cry I wonder where I went wrong I listen to
 Twaylor:
3d printing a glider (for 150 pound 5'8 person - prolly should make it for up to
Twaylor:
3d printing a glider (for 150 pound 5'8 person - prolly should make it for up to
 cullenn:
pitter patter sound of rain gently tapping my window tonight. calming, soothing, right? not for me.
cullenn:
pitter patter sound of rain gently tapping my window tonight. calming, soothing, right? not for me.

 Arriyanalol:
DON'T BUY TICKETS TO SEAWORLD i watched a documentary on seaworld and its sad wha
Arriyanalol:
DON'T BUY TICKETS TO SEAWORLD i watched a documentary on seaworld and its sad wha
 natalieee:
who else wants a job in biology? I love biomedical science and want to work with
Twaylor:
Time flies doesn't it? I tried to not be the second squeaky wheel of the household and ended up hurting myself and others severely.
natalieee:
who else wants a job in biology? I love biomedical science and want to work with
Twaylor:
Time flies doesn't it? I tried to not be the second squeaky wheel of the household and ended up hurting myself and others severely.
 clllaaaaaire:
any tips? the quality isn't the best because I am using this site on my computer
clllaaaaaire:
any tips? the quality isn't the best because I am using this site on my computer