 Rylee88:
Help Me PLEASE!!!!
Rylee88:
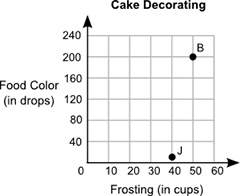
The table shows the relationship between the number of drops of food color added to different number of cups of cake frosting: Cups of Frosting Drops of Food Color 2 8 3 12 4 16 Which point below shows an equivalent ratio in this situation?
 Adverturetime57:
K Hold On
 josiahcantcount:
I would say the first one A graph is shown. The title of the graph is Cake Decorating. The horizontal axis label is Frosting in cups. The horizontal axis values are 0, 10, 20, 30, 40, 50, 60. The vertical axis label is Food Color in drops. The vertical axis values are 0, 20, 40, 60, 80, 100, 120.
Adverturetime57:
is there any answer choices?
Rylee88:
Point B, because if cups of frosting are 50, then drops of food coloring will be 200 Point B, because if drops of food coloring are 50, then cups of frosting will be 200 Point J, because if cups of frosting are 40, then drops of food coloring will be 10 Point J, because if drops of food coloring are 40, then cups of frosting will be 10
Adverturetime57:
I would say the first one A graph is shown. The title of the graph is Cake Decorating. The horizontal axis label is Frosting in cups. The horizontal axis values are 0, 10, 20, 30, 40, 50, 60. The vertical axis label is Food Color in drops. The vertical axis values are 0, 20, 40, 60, 80, 100, 120. Same
josiahcantcount:
Rylee88:
lol
Rylee88:
So thats the Answer? XD
josiahcantcount:
Rylee88:
Which one lol
Rylee88:
Theres two point Bs lol
josiahcantcount:
Rylee88:
Oh ok thx lol
josiahcantcount:
no problem
Adverturetime57:
nvm
josiahcantcount:
lmao
Join our real-time social learning platform and learn together with your friends!
 Twaylor:
Time flies doesn't it? I tried to not be the second squeaky wheel of the household and ended up hurting myself and others severely.
Twaylor:
Time flies doesn't it? I tried to not be the second squeaky wheel of the household and ended up hurting myself and others severely.
 clllaaaaaire:
any tips? the quality isn't the best because I am using this site on my computer
clllaaaaaire:
any tips? the quality isn't the best because I am using this site on my computer
 Midnight97:
Kinda a roleplay story between me and my friend enjoy... Part one Forgive me for all the screenshots.
Midnight97:
Kinda a roleplay story between me and my friend enjoy... Part one Forgive me for all the screenshots.
 StevenisGhost:
what type of song should I make next, and will y'all go check out my new song on
Midnight97:
My drawing sure changed over the years look at these two pictures from 2024 to no
StevenisGhost:
what type of song should I make next, and will y'all go check out my new song on
Midnight97:
My drawing sure changed over the years look at these two pictures from 2024 to no
 EdwinJsHispanic:
"poem" love is So Beautiful to have. But it's so hard to have. At this point I don't know whether its worth the wait Or if it's just millions of miles to re
EdwinJsHispanic:
"poem" love is So Beautiful to have. But it's so hard to have. At this point I don't know whether its worth the wait Or if it's just millions of miles to re
EdwinJsHispanic:
"poem" love is So Beautiful to have. But it's so hard to have. At this point I don't know whether its worth the wait Or if it's just millions of miles to re
EdwinJsHispanic:
"poem" love is So Beautiful to have. But it's so hard to have. At this point I don't know whether its worth the wait Or if it's just millions of miles to re
 Breathless:
I don't know if this would be considered art, but its close enough I believe, Any
Breathless:
I don't know if this would be considered art, but its close enough I believe, Any