 niahmk:
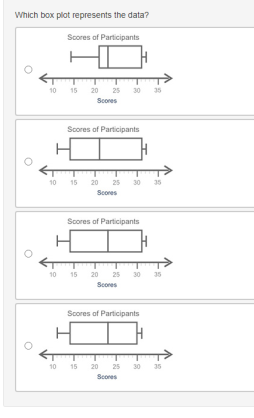
)The following data indicate the scores of some students in a competition: 30 points 11 points 14 points 23 points 21 points 31 points 32 points Which box plot represents the data? A box plot titled "Scores of Participants" and labeled "Scores" uses a number line from 10 to 35 with primary markings and labels at 10, 15, 20, 25, 30, and 35. The box extends from 21 to 31 on the number line. A line in the box is at 23. The whiskers end at 14 and 32. A box plot titled "Scores of Participants" and labeled "Scores" uses a number line from 10 to 35 with primary markings and labels at 10, 15, 20, 25, 30, 35. The box extends from 14 to 31 on the number line. A line in the box is at 21. The whiskers end at 11 and 32. A box plot titled "Scores of Participants" and labeled "Scores" uses a number line from 10 to 35 with primary markings and labels at 10, 15, 20, 25, 30, and 35. The box extends from 14 to 31 on the number line. A line in the box is at 23. The whiskers end at 11 and 32. A box plot titled "Scores of Participants" and labeled "Scores" uses a number line from 10 to 35 with primary markings and labels at 10, 15, 20, 25, 30, and 35. The box extends from 14 to 30 on the number line. A line in the box is at 23. The whiskers end at 11 and 31.
 QuestionCoveBot:
Can you take a screenshots of the box plots?
 QuestionCoveBot:
Alright. Thanks. Time for elimination process. Eliminate D because the box only goes until 30, not 32
QuestionCoveBot:
What you need is one that the whiskers end at 11 and 32 (all but A and D). So eliminate A too. You have B and C left now.
QuestionCoveBot:
The difference between them is that B has a line at 21, while C has one at 23.
niahmk:
oh wait, im pretty sure its C
QuestionCoveBot:
Is 21 or 23 closer to the middle? 11, 14, 21, 23, 30, 31, 32 The middle would be what number? So then, which is closer, 21 or 23?
QuestionCoveBot:
Yes, you are correct. It is C. (:
Join our real-time social learning platform and learn together with your friends!
 Twaylor:
Time flies doesn't it? I tried to not be the second squeaky wheel of the household and ended up hurting myself and others severely.
Twaylor:
Time flies doesn't it? I tried to not be the second squeaky wheel of the household and ended up hurting myself and others severely.
 clllaaaaaire:
any tips? the quality isn't the best because I am using this site on my computer
clllaaaaaire:
any tips? the quality isn't the best because I am using this site on my computer
 Midnight97:
Kinda a roleplay story between me and my friend enjoy... Part one Forgive me for all the screenshots.
Midnight97:
Kinda a roleplay story between me and my friend enjoy... Part one Forgive me for all the screenshots.
 StevenisGhost:
what type of song should I make next, and will y'all go check out my new song on
Midnight97:
My drawing sure changed over the years look at these two pictures from 2024 to no
StevenisGhost:
what type of song should I make next, and will y'all go check out my new song on
Midnight97:
My drawing sure changed over the years look at these two pictures from 2024 to no
 EdwinJsHispanic:
"poem" love is So Beautiful to have. But it's so hard to have. At this point I don't know whether its worth the wait Or if it's just millions of miles to re
EdwinJsHispanic:
"poem" love is So Beautiful to have. But it's so hard to have. At this point I don't know whether its worth the wait Or if it's just millions of miles to re
EdwinJsHispanic:
"poem" love is So Beautiful to have. But it's so hard to have. At this point I don't know whether its worth the wait Or if it's just millions of miles to re
EdwinJsHispanic:
"poem" love is So Beautiful to have. But it's so hard to have. At this point I don't know whether its worth the wait Or if it's just millions of miles to re
 Breathless:
I don't know if this would be considered art, but its close enough I believe, Any
Breathless:
I don't know if this would be considered art, but its close enough I believe, Any