 gababb09:
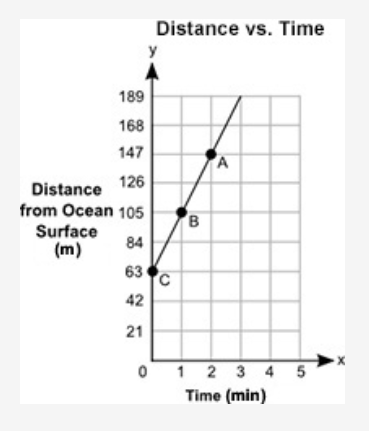
The graph shows the depth, y, in meters, of a shark from the surface of an ocean for a certain amount of time, x, in minutes: graph is posted in replies. Part A: Describe how you can use similar triangles to explain why the slope of the graph between points A and B is the same as the slope of the graph between points A and C. Part B: What are the initial value and slope of the graph, and what do they represent?
 snowflake0531:
For Part 1: Well.... we can use SAS, because the right angles are equal, and the amount it 'rises' and 'runs' are equal in length So, they're similar Which means we only need one slope, and that is the slope for hte whole line
snowflake0531:
For Part 2: Initial value is the y-intercept, where it crosses the y-axis And the slope, you can calculate that by rise/run, find two points, find how much it 'rose', find how much it 'ran' and divide, rise over run, since that is the slope
snowflake0531:
For what they represent initial value is y-intercept, so it's when x=0, the beginning of this And slope represents how much it movies per minute
 QUEENBAIROFTHEGAYS:
21
Join our real-time social learning platform and learn together with your friends!
 Twaylor:
Time flies doesn't it? I tried to not be the second squeaky wheel of the household and ended up hurting myself and others severely.
Twaylor:
Time flies doesn't it? I tried to not be the second squeaky wheel of the household and ended up hurting myself and others severely.
 clllaaaaaire:
any tips? the quality isn't the best because I am using this site on my computer
clllaaaaaire:
any tips? the quality isn't the best because I am using this site on my computer
 Midnight97:
Kinda a roleplay story between me and my friend enjoy... Part one Forgive me for all the screenshots.
Midnight97:
Kinda a roleplay story between me and my friend enjoy... Part one Forgive me for all the screenshots.
 StevenisGhost:
what type of song should I make next, and will y'all go check out my new song on
Midnight97:
My drawing sure changed over the years look at these two pictures from 2024 to no
StevenisGhost:
what type of song should I make next, and will y'all go check out my new song on
Midnight97:
My drawing sure changed over the years look at these two pictures from 2024 to no
 EdwinJsHispanic:
"poem" love is So Beautiful to have. But it's so hard to have. At this point I don't know whether its worth the wait Or if it's just millions of miles to re
EdwinJsHispanic:
"poem" love is So Beautiful to have. But it's so hard to have. At this point I don't know whether its worth the wait Or if it's just millions of miles to re
EdwinJsHispanic:
"poem" love is So Beautiful to have. But it's so hard to have. At this point I don't know whether its worth the wait Or if it's just millions of miles to re
EdwinJsHispanic:
"poem" love is So Beautiful to have. But it's so hard to have. At this point I don't know whether its worth the wait Or if it's just millions of miles to re
 Breathless:
I don't know if this would be considered art, but its close enough I believe, Any
Breathless:
I don't know if this would be considered art, but its close enough I believe, Any