 gababb09:
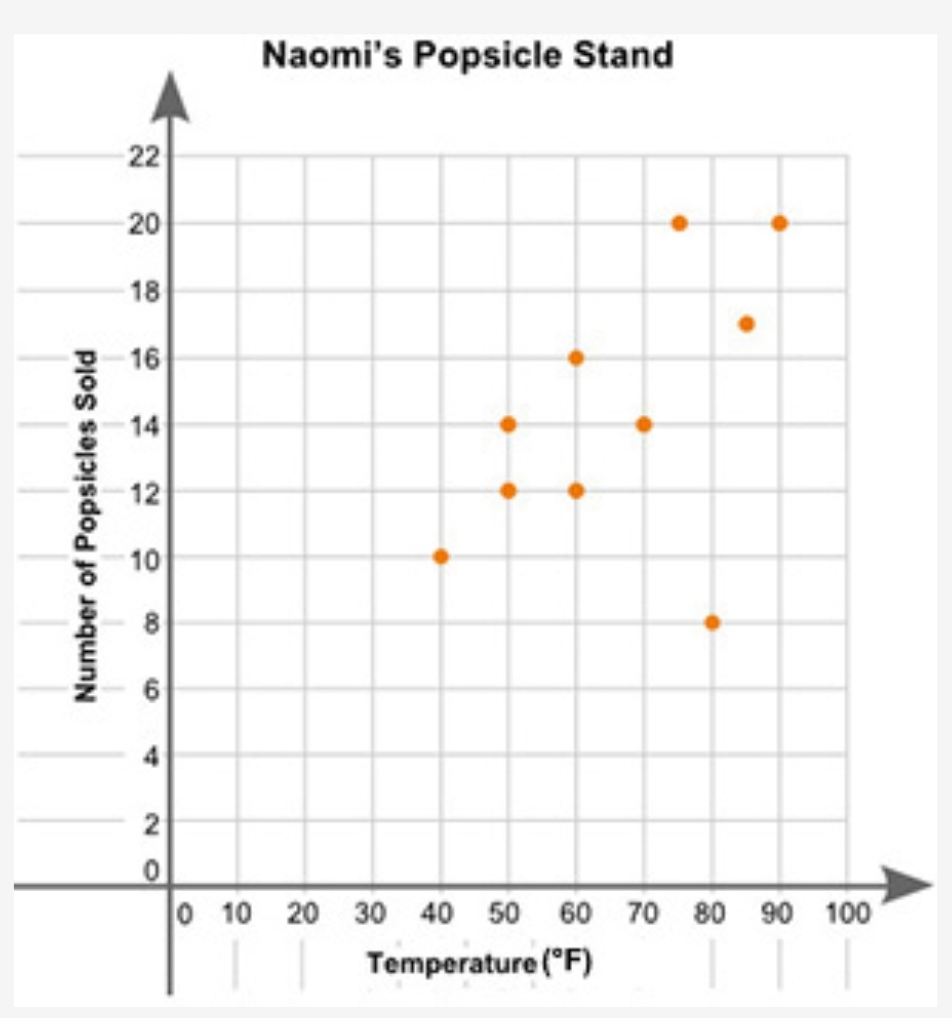
Naomi plotted the graph below to show the relationship between the temperature of her city and the number of popsicles she sold daily: Graph in replies. Part A: In your own words, describe the relationship between the temperature of the city and the number of popsicles sold. Part B: Describe how you can make the line of best fit. Write the approximate slope and y-intercept of the line of best fit. Show your work, including the points that you use to calculate the slope and y-intercept.
 SmokeyBrown:
For part A, think of how the number of popsicles sold changes as the temperature gets higher. For part B, there should be an equation for calculating the best slope and intercept for a set of data points. I think this resource would be useful to help understand how that works: https://courses.lumenlearning.com/introstats1/chapter/the-regression-equation/ After you calculate the answer for yourself, you can use this calculator to check your work: https://www.easycalculation.com/statistics/regression.php#:~:text=A%20linear%20regression%20line%20has%20an%20equation%20of,%28the%20value%20of%20y%20when%20x%20%3D%200%29.
SmokeyBrown:
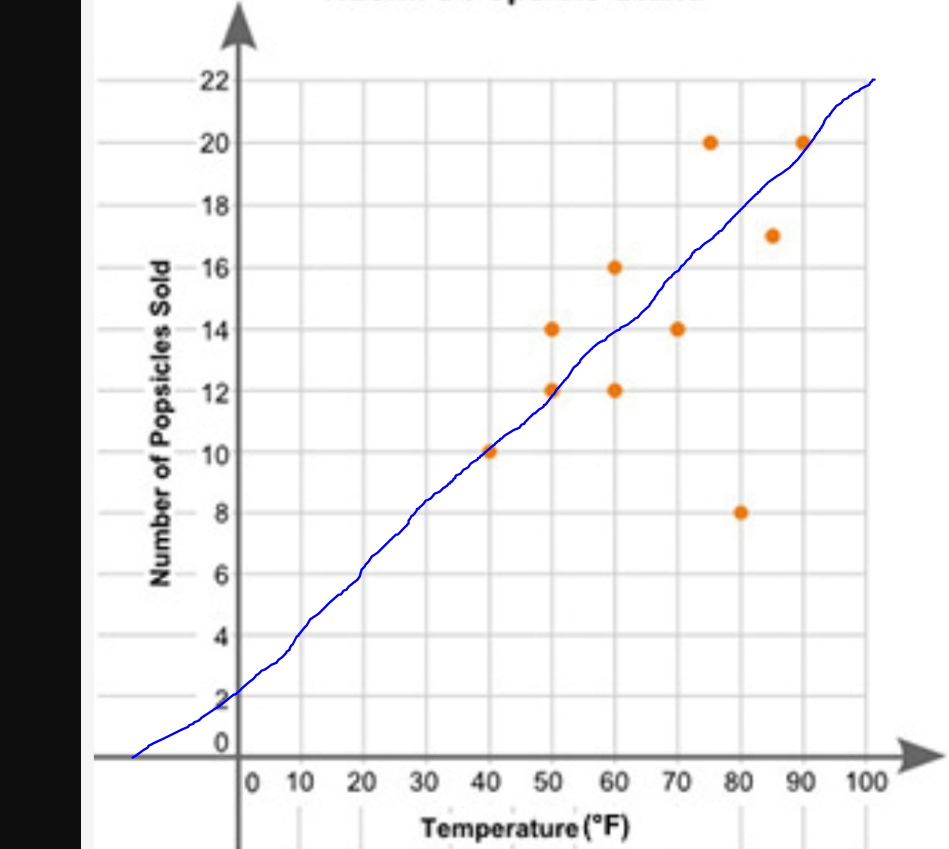
Although, now that I look at the graph, it seems like the line of best fit would look something like this (assuming we can ignore that point in the bottom right) Notice how the line passes exactly through the "middle" of all the points (not counting the one in the bottom right) So, intuitively, the answer would be something like that, I think
Join our real-time social learning platform and learn together with your friends!
 Twaylor:
Time flies doesn't it? I tried to not be the second squeaky wheel of the household and ended up hurting myself and others severely.
Twaylor:
Time flies doesn't it? I tried to not be the second squeaky wheel of the household and ended up hurting myself and others severely.
 clllaaaaaire:
any tips? the quality isn't the best because I am using this site on my computer
clllaaaaaire:
any tips? the quality isn't the best because I am using this site on my computer
 Midnight97:
Kinda a roleplay story between me and my friend enjoy... Part one Forgive me for all the screenshots.
Midnight97:
Kinda a roleplay story between me and my friend enjoy... Part one Forgive me for all the screenshots.
 StevenisGhost:
what type of song should I make next, and will y'all go check out my new song on
Midnight97:
My drawing sure changed over the years look at these two pictures from 2024 to no
StevenisGhost:
what type of song should I make next, and will y'all go check out my new song on
Midnight97:
My drawing sure changed over the years look at these two pictures from 2024 to no
 EdwinJsHispanic:
"poem" love is So Beautiful to have. But it's so hard to have. At this point I don't know whether its worth the wait Or if it's just millions of miles to re
EdwinJsHispanic:
"poem" love is So Beautiful to have. But it's so hard to have. At this point I don't know whether its worth the wait Or if it's just millions of miles to re
EdwinJsHispanic:
"poem" love is So Beautiful to have. But it's so hard to have. At this point I don't know whether its worth the wait Or if it's just millions of miles to re
EdwinJsHispanic:
"poem" love is So Beautiful to have. But it's so hard to have. At this point I don't know whether its worth the wait Or if it's just millions of miles to re
 Breathless:
I don't know if this would be considered art, but its close enough I believe, Any
Breathless:
I don't know if this would be considered art, but its close enough I believe, Any