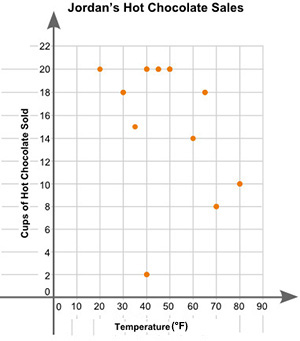
(06.02)Jordan plotted the graph below to show the relationship between the temperature of his city and the number of cups of hot chocolate he sold daily: A scatter plot is shown with the title Jordans Hot Chocolate Sales. The x axis is labeled High Temperature and the y axis is labeled Cups of Hot Chocolate Sold. Data points are located at 20 and 20, 30 and 18, 40 and 20, 35 and 15, 50 and 20, 45 and 20, 60 and 14, 65 and 18, 80 and 10, 70 and 8, 40 and 2. Part A: In your own words, describe the relationship between the temperature of the city and the number of cups of hot chocolate sold. (2 points) Part B: Describe how you can make the line of best fit. Write the approximate slope and y-intercept of the line of best fit. Show your work, including the points that you use to calculate the slope and y-intercept. (3 points)
??
 nav50:
II think you should write in your own word then solve the problem just fine the slope
nav50:
that's what I think
 darkknight:
"Part A: In your own words, describe the relationship between the temperature of the city and the number of cups of hot chocolate sold. (2 points)" Have you ever heard of positive correlation? negative correlation? No correlation? Basically what the question is asking you is what seems to be happening to the cups of hot chocolate sold as the temperature increases?
darkknight:
"Part B: Describe how you can make the line of best fit. Write the approximate slope and y-intercept of the line of best fit. Show your work, including the points that you use to calculate the slope and y-intercept. (3 points)" What math is this, algebra 1 ish? do you know how to make the line of best fit?
so for part A i could put "whats happning to the cups of hot chocolate is that as the temperature increases the cups of hot chocolate increases"?
or is that wrong
darkknight:
no sorry, i am asking you what happens to the cups of hot chocolate is that as the temperature increases the cups of hot chocolate increases looking at the graph
yeah it is
darkknight:
huh. What is what?
darkknight:
Look at the graph, what is the general trend, as the temperature increases WHAT happens to the number of hot chocolates sold
it increases i think
darkknight:
how so?
wait no its decreases
the cups increases and then the temp decreases
darkknight:
that is correct, this means you have a negative correlation
darkknight:
oohhhhh
thank you so much
darkknight:
np, do you know how to do line of best fit, part b?
wait one sec plz
darkknight:
take your time (:
ok im back
can you help m with part b as well plz?
help...
darkknight:
So what math class is this?
algebra
darkknight:
did your teacher teach how to find the line of best fit?
yh i read the lesson but like i still need help understanding how to find the line of best fit step be step
darkknight:
So, in algebra 1, what you want to do is take 2 points where if you draw a line through them, the line would go through a majority of the graph, for example (random example) |dw:1621654650370:dw|here, i took 2 points and drew a line that goes through the middle, so you use the same process for your graph
darkknight:
We can find the slope and y-intercept after you determine your line of best fit, a hint, try to draw on the picture your line of best fit and send that here or use the draw feature
ok
yh i cant draw it
i tried
darkknight:
At the level yu are at, I would say it doesn't have to be perfect, draw a line from (20,20) and (70, 8) and call taht your line of best fit
darkknight:
Can you find the slope and y-intercept?
yh rise over run to find slope of a line
slope of a line is usually represented with the variable "m" in equations.
darkknight:
\[m=(y _{2}-y _{1})/(x _{2}-x_{1})\] can you plug in the 2 points I gave you into this formula? where \[(20, 20)=(x _{1},y _{1})\] and \[(70,8)=(x _{2},y _{2})\]
yh ik how to do that
 SaltTheLoser:
the answer is reuben. minnesota
darkknight:
is this a test ._.
12/50
darkknight:
What
20-8=12 20-70=-50
darkknight:
Join our real-time social learning platform and learn together with your friends!
 Twaylor:
Time flies doesn't it? I tried to not be the second squeaky wheel of the household and ended up hurting myself and others severely.
Twaylor:
Time flies doesn't it? I tried to not be the second squeaky wheel of the household and ended up hurting myself and others severely.
 clllaaaaaire:
any tips? the quality isn't the best because I am using this site on my computer
clllaaaaaire:
any tips? the quality isn't the best because I am using this site on my computer
 Midnight97:
Kinda a roleplay story between me and my friend enjoy... Part one Forgive me for all the screenshots.
Midnight97:
Kinda a roleplay story between me and my friend enjoy... Part one Forgive me for all the screenshots.
 StevenisGhost:
what type of song should I make next, and will y'all go check out my new song on
Midnight97:
My drawing sure changed over the years look at these two pictures from 2024 to no
StevenisGhost:
what type of song should I make next, and will y'all go check out my new song on
Midnight97:
My drawing sure changed over the years look at these two pictures from 2024 to no
 EdwinJsHispanic:
"poem" love is So Beautiful to have. But it's so hard to have. At this point I don't know whether its worth the wait Or if it's just millions of miles to re
EdwinJsHispanic:
"poem" love is So Beautiful to have. But it's so hard to have. At this point I don't know whether its worth the wait Or if it's just millions of miles to re
EdwinJsHispanic:
"poem" love is So Beautiful to have. But it's so hard to have. At this point I don't know whether its worth the wait Or if it's just millions of miles to re
EdwinJsHispanic:
"poem" love is So Beautiful to have. But it's so hard to have. At this point I don't know whether its worth the wait Or if it's just millions of miles to re
 Breathless:
I don't know if this would be considered art, but its close enough I believe, Any
Breathless:
I don't know if this would be considered art, but its close enough I believe, Any