 niahmk:
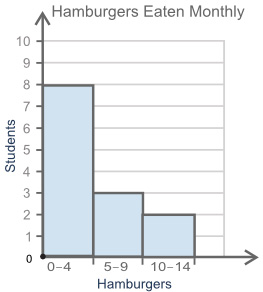
The histogram below shows information about the number of hamburgers students ate in a month: A histogram is titled Hamburgers Eaten Monthly, the horizontal axis is labeled Hamburgers, and the vertical axis is labeled Students. The range on the horizontal axis is 0 to 4, 5 to 9, and 10 to 14. The values on the vertical axis are from 0 to 10 at intervals of 1. The first bin goes to 8, the second bin to 3, the third bin to 2. Which information is provided in the histogram? The mean number of hamburgers eaten The median number of hamburgers eaten The number of students who ate 5 hamburgers or fewer The number of students who ate 10 hamburgers or more
 MrMudd183:
What answer choices to you think we can get rid of with the information provided?
 Imagine:
Which 2 could you eliminate?
niahmk:
C and D i think
MrMudd183:
I think we can eliminate A and B...here's why
MrMudd183:
The histogram doesn't provide exact data easy enough to determine what the mean and median is of the given data. So that will leave us with C and D
niahmk:
i am pretty sure the answer is D then because the graph doesnt really show who ate 5 hamburgers or fewer
MrMudd183:
Yea, it only has: 0-4, 5-9, and 10 or more
MrMudd183:
Good job!
Join our real-time social learning platform and learn together with your friends!
 Twaylor:
Time flies doesn't it? I tried to not be the second squeaky wheel of the household and ended up hurting myself and others severely.
Twaylor:
Time flies doesn't it? I tried to not be the second squeaky wheel of the household and ended up hurting myself and others severely.
 clllaaaaaire:
any tips? the quality isn't the best because I am using this site on my computer
clllaaaaaire:
any tips? the quality isn't the best because I am using this site on my computer
 Midnight97:
Kinda a roleplay story between me and my friend enjoy... Part one Forgive me for all the screenshots.
Midnight97:
Kinda a roleplay story between me and my friend enjoy... Part one Forgive me for all the screenshots.
 StevenisGhost:
what type of song should I make next, and will y'all go check out my new song on
Midnight97:
My drawing sure changed over the years look at these two pictures from 2024 to no
StevenisGhost:
what type of song should I make next, and will y'all go check out my new song on
Midnight97:
My drawing sure changed over the years look at these two pictures from 2024 to no
 EdwinJsHispanic:
"poem" love is So Beautiful to have. But it's so hard to have. At this point I don't know whether its worth the wait Or if it's just millions of miles to re
EdwinJsHispanic:
"poem" love is So Beautiful to have. But it's so hard to have. At this point I don't know whether its worth the wait Or if it's just millions of miles to re
EdwinJsHispanic:
"poem" love is So Beautiful to have. But it's so hard to have. At this point I don't know whether its worth the wait Or if it's just millions of miles to re
EdwinJsHispanic:
"poem" love is So Beautiful to have. But it's so hard to have. At this point I don't know whether its worth the wait Or if it's just millions of miles to re
 Breathless:
I don't know if this would be considered art, but its close enough I believe, Any
Breathless:
I don't know if this would be considered art, but its close enough I believe, Any