A coordinate grid from negative 2 to 0 to positive 2 is drawn. There are three grid lines between a whole unit on the grid. Part A: Which point represents the origin? Part B: Starting from the origin, explain how to plot the following three points accurately: (1, −1) (−1, 1.25) (−2, fraction 3 over 4)
please help me
there are 64 little squares in each quadrant
 mhanifa:
Do you have the picture?
i have one but i cant put it on here
mhanifa:
For part A, do you know what is the origin. What is its coordinates?
I dont know the origin but the coordinates are at the bottom of the question
mhanifa:
The origin is the center of the grid, with coordinates (0, 0), do you have it in the picture?
yes but there is only 1 zero
mhanifa:
Ok, that's the one. Its Part A. For Part B, do you know how to plot the points?
yes
mhanifa:
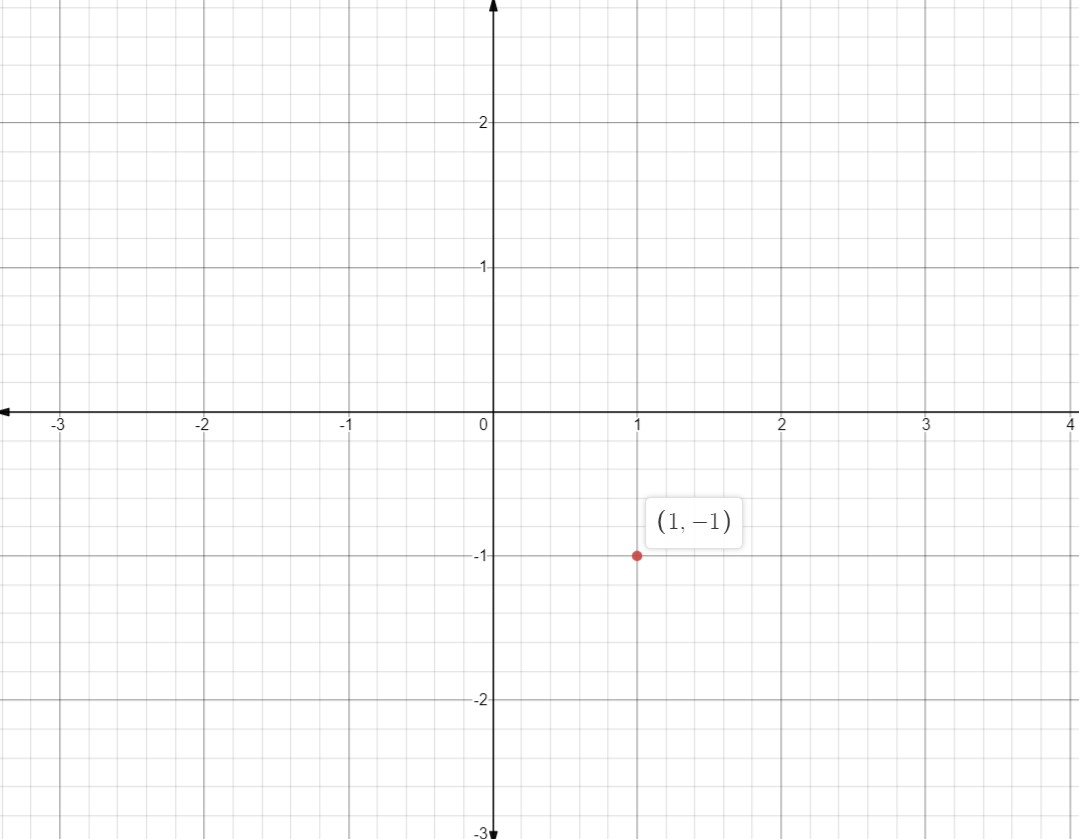
Then it should be easy for you. Let's practice point (1, -1), how do you plot this?
put it in the 2nd quadrant then find the one on the right side take it to the left and down to the -1
mhanifa:
Can you sketch it here, not too clear to me.
|dw:1623518217604:dw|
mhanifa:
Thanks but this is incorrect.
?
mhanifa:
Pairs of coordinates represent (x, y) the first number, the x-coordinate represents the distance left or right from the origin. The second number, the y-coordinate represents the distance up or down from the origin.
mhanifa:
To plot (1, -1) you go right 1 unit and then down 1 unit (down as it is negative)
mhanifa:
Let me know if its clear.
I dont understand
mhanifa:
This is opposite of what you did to plot the point. First number means left or right, the second number means up or down.
oh ok
I get it now
mhanifa:
Can you do the other points?
I think so
mhanifa:
Let me know if any difficulties and good luck.
|dw:1623519001776:dw|
does it go like that since the first number is negative?
mhanifa:
Yes for the second point. You can plot this more accurately on the grid. Its exactly 1 unit left and 1 and quarter unit up.
I know, that's what I tried to do.
mhanifa:
I think you are done. Good job.
Thank you so much
mhanifa:
You are welcome!
Join our real-time social learning platform and learn together with your friends!
 Twaylor:
Time flies doesn't it? I tried to not be the second squeaky wheel of the household and ended up hurting myself and others severely.
Twaylor:
Time flies doesn't it? I tried to not be the second squeaky wheel of the household and ended up hurting myself and others severely.
 clllaaaaaire:
any tips? the quality isn't the best because I am using this site on my computer
clllaaaaaire:
any tips? the quality isn't the best because I am using this site on my computer
 Midnight97:
Kinda a roleplay story between me and my friend enjoy... Part one Forgive me for all the screenshots.
Midnight97:
Kinda a roleplay story between me and my friend enjoy... Part one Forgive me for all the screenshots.
 StevenisGhost:
what type of song should I make next, and will y'all go check out my new song on
Midnight97:
My drawing sure changed over the years look at these two pictures from 2024 to no
StevenisGhost:
what type of song should I make next, and will y'all go check out my new song on
Midnight97:
My drawing sure changed over the years look at these two pictures from 2024 to no
 EdwinJsHispanic:
"poem" love is So Beautiful to have. But it's so hard to have. At this point I don't know whether its worth the wait Or if it's just millions of miles to re
EdwinJsHispanic:
"poem" love is So Beautiful to have. But it's so hard to have. At this point I don't know whether its worth the wait Or if it's just millions of miles to re
EdwinJsHispanic:
"poem" love is So Beautiful to have. But it's so hard to have. At this point I don't know whether its worth the wait Or if it's just millions of miles to re
EdwinJsHispanic:
"poem" love is So Beautiful to have. But it's so hard to have. At this point I don't know whether its worth the wait Or if it's just millions of miles to re
 Breathless:
I don't know if this would be considered art, but its close enough I believe, Any
Breathless:
I don't know if this would be considered art, but its close enough I believe, Any