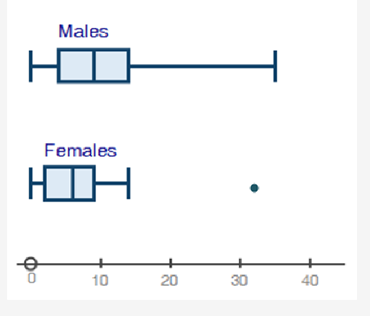
Use the box plots comparing the number of males and number of females attending the latest superhero movie each day for a month to answer the questions. Two box plots shown. The top one is labeled Males. Minimum at 0, Q1 at 3, median at 10, Q3 at 15, maximum at 35. The bottom box plot is labeled Females. Minimum at 0, Q1 at 2, median at 6, Q3 at 9, maximum at 14, and a point at 31. Part A: Estimate the IQR for the males' data. (2 points) Part B: Estimate the difference between the median values of each data set. (2 points) Part C: Describe the distribution of the data and if the mean or median would be a better measure of center for each. (4 points) Part D: Provide a possible reason for the outlier in the data set. (2 points)
 jhonyy9:
please try post a ss about this box plots details so will be more easy understandably
okie!
 mhanifa:
Do you know how to calculate the IQR?
mhanifa:
IQR = Q3 - Q1, use this formula
mhanifa:
You have listed the values. For part B, compare the medians, you have listed them as well
mhanifa:
np
Join our real-time social learning platform and learn together with your friends!
 Twaylor:
Time flies doesn't it? I tried to not be the second squeaky wheel of the household and ended up hurting myself and others severely.
Twaylor:
Time flies doesn't it? I tried to not be the second squeaky wheel of the household and ended up hurting myself and others severely.
 clllaaaaaire:
any tips? the quality isn't the best because I am using this site on my computer
clllaaaaaire:
any tips? the quality isn't the best because I am using this site on my computer
 Midnight97:
Kinda a roleplay story between me and my friend enjoy... Part one Forgive me for all the screenshots.
Midnight97:
Kinda a roleplay story between me and my friend enjoy... Part one Forgive me for all the screenshots.
 StevenisGhost:
what type of song should I make next, and will y'all go check out my new song on
Midnight97:
My drawing sure changed over the years look at these two pictures from 2024 to no
StevenisGhost:
what type of song should I make next, and will y'all go check out my new song on
Midnight97:
My drawing sure changed over the years look at these two pictures from 2024 to no
 EdwinJsHispanic:
"poem" love is So Beautiful to have. But it's so hard to have. At this point I don't know whether its worth the wait Or if it's just millions of miles to re
EdwinJsHispanic:
"poem" love is So Beautiful to have. But it's so hard to have. At this point I don't know whether its worth the wait Or if it's just millions of miles to re
EdwinJsHispanic:
"poem" love is So Beautiful to have. But it's so hard to have. At this point I don't know whether its worth the wait Or if it's just millions of miles to re
EdwinJsHispanic:
"poem" love is So Beautiful to have. But it's so hard to have. At this point I don't know whether its worth the wait Or if it's just millions of miles to re
 Breathless:
I don't know if this would be considered art, but its close enough I believe, Any
Breathless:
I don't know if this would be considered art, but its close enough I believe, Any