 iosangel:
systems of inequalities
 FexrlessRxby:
SS?
 AnimeWeeebLMAO:
??
iosangel:
y>−2 x+y≤4
FexrlessRxby:
Do you know what to do first?
iosangel:
plot
FexrlessRxby:
Good good. Then what?
iosangel:
i dont know how to plot y>-2
FexrlessRxby:
Do you know the difference between less than and less than or equal to?
iosangel:
yes
iosangel:
y is greater that -2
FexrlessRxby:
Let me rephrase that. Do you know the difference between the lines?
iosangel:
yes the greater than or equal to? If its greater than or equal to/ less than or equal to it has to be a solid line Right?
FexrlessRxby:
That is correct.
FexrlessRxby:
And what about the normal greater than?
iosangel:
dashed line
FexrlessRxby:
Correct again.
FexrlessRxby:
So y>-2 is a dashed line, we know that so far. Where on the grid would it go?
iosangel:
im not sure
iosangel:
-2 would be the slope?
FexrlessRxby:
That wouldn't be correct because it's not in slope-intercept.
iosangel:
it would be the y intercept?
FexrlessRxby:
Yes. Or in other words, where the line is on the grid.
iosangel:
oh there wouldnt be a slope
FexrlessRxby:
Yes.
iosangel:
so nowi shade the top because > = greater than = top/right side?
FexrlessRxby:
That is correct.
iosangel:
ok thats where i get confused, i have another example where it says y> x-2 but for that i would shade left side, why is that?
FexrlessRxby:
Let me graph that real quick.
FexrlessRxby:
I believe why that is is because there's an "x" in the problem.
FexrlessRxby:
In the original y>-2, there's no "x".
FexrlessRxby:
But in this problem/inequality, there's an "x", so that would cause the shading to switch to the left side.
iosangel:
now im not suere how to graph the second equation
FexrlessRxby:
It would still be the same line, just shaded on the left side instead of the right.
iosangel:
what
iosangel:
4 is the y-intercept in the second equation
iosangel:
im confused?
 SmokeyBrown:
|dw:1629828181112:dw| Please excuse my poor drawing skills. As FexrlessRxby was explaining, one way to solve this problem would be to plot the lines (as I tried to do) and then to shade the regions of the graph, based on the sign of the inequality (shade above and to the right for "greater-than"; shade below and to the left for "less-than") The portion where the shading overlaps would be the solution to the system.
iosangel:
And I should shade the same for this x+y≤4
SmokeyBrown:
My mistake, I graphed y >= 2, instead of y > -2, as the question asks (also, the line would be dotted, not solid, for a > sign, as opposed to >=. The drawing still illustrates the idea, even though I got the number wrong. The blue line and shading represents the region y >= 2 and the green line and shading represents the region x+y <= 4
iosangel:
how did u graph x+y≤4
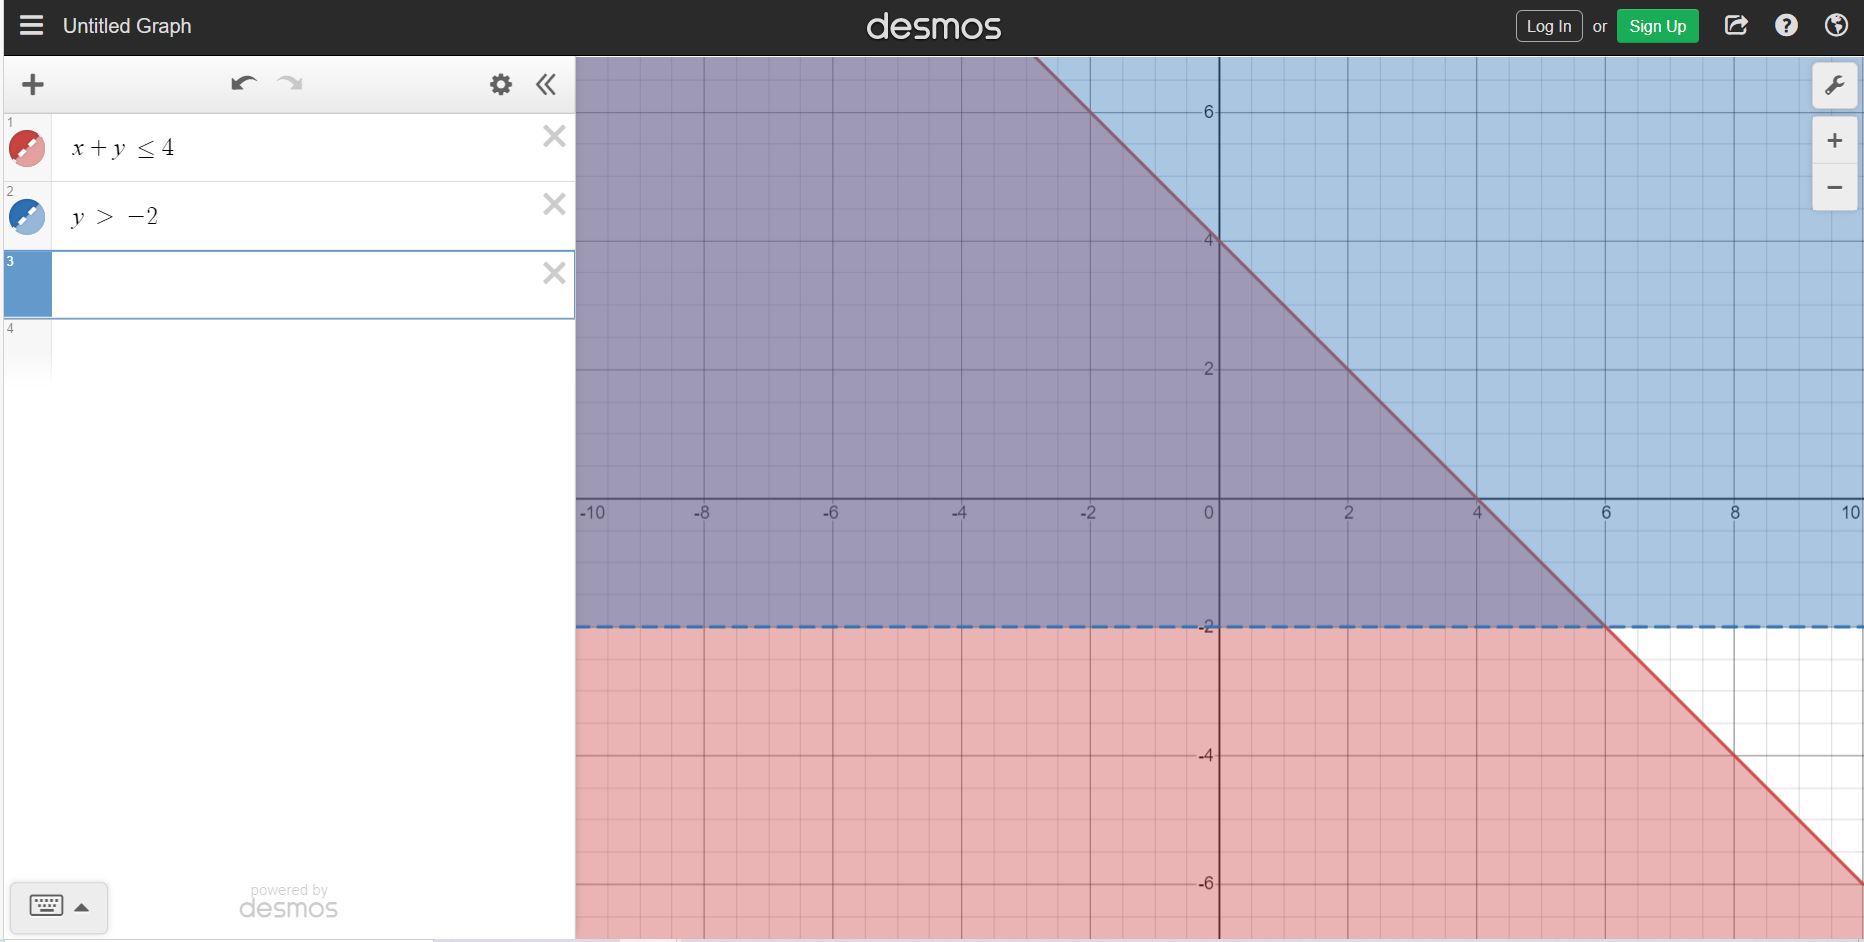
SmokeyBrown:
Apologies, my drawing was not very good. Please refer to this diagram made using Desmos graphing calculator for a clearer picture. x + y ≤ 4 can also be rewritten as y ≤ -x + 4, if that makes it easier to visualize. The graph would be the line y = -x + 4, with shading underneath the line, since the symbol is "≤", signifying "less than", or below the line
 iosangel:
where did you get the - in y ≤ -x + 4
SmokeyBrown:
iosangel:
oh i forgot about that
iosangel:
but the full question was Which ordered pair is a solution to the system of inequalities? (1, 3) (1, 5) (0, −4) (−2, −3) doesn't that mean which of these options would be in the double shaded region
SmokeyBrown:
That's right, you would want to find out which of the points listed falls within the double-shaded region, meaning it satisfies both of the inequalities in the system
 BakugoBasically:
i was learning about this today
iosangel:
so (1,3)
SmokeyBrown:
iosangel:
Thank you
Join our real-time social learning platform and learn together with your friends!
 Strawberryluna:
Read my poem. Im not for criticism its a poem I wrote after my breakup: Youu2019ll never understand the way you made me break, I hate that I still love you
Strawberryluna:
Read my poem. Im not for criticism its a poem I wrote after my breakup: Youu2019ll never understand the way you made me break, I hate that I still love you
 Bounty:
first poem in a min- (tittle)? one moment i'm fine I smile till my face burns I laugh till I cant breath Then I cry I wonder where I went wrong I listen to
Bounty:
first poem in a min- (tittle)? one moment i'm fine I smile till my face burns I laugh till I cant breath Then I cry I wonder where I went wrong I listen to
 Twaylor:
3d printing a glider (for 150 pound 5'8 person - prolly should make it for up to
Twaylor:
3d printing a glider (for 150 pound 5'8 person - prolly should make it for up to
 cullenn:
pitter patter sound of rain gently tapping my window tonight. calming, soothing, right? not for me.
cullenn:
pitter patter sound of rain gently tapping my window tonight. calming, soothing, right? not for me.

 Arriyanalol:
DON'T BUY TICKETS TO SEAWORLD i watched a documentary on seaworld and its sad wha
Arriyanalol:
DON'T BUY TICKETS TO SEAWORLD i watched a documentary on seaworld and its sad wha
 natalieee:
who else wants a job in biology? I love biomedical science and want to work with
Twaylor:
Time flies doesn't it? I tried to not be the second squeaky wheel of the household and ended up hurting myself and others severely.
natalieee:
who else wants a job in biology? I love biomedical science and want to work with
Twaylor:
Time flies doesn't it? I tried to not be the second squeaky wheel of the household and ended up hurting myself and others severely.
 clllaaaaaire:
any tips? the quality isn't the best because I am using this site on my computer
clllaaaaaire:
any tips? the quality isn't the best because I am using this site on my computer