 Gucchi:
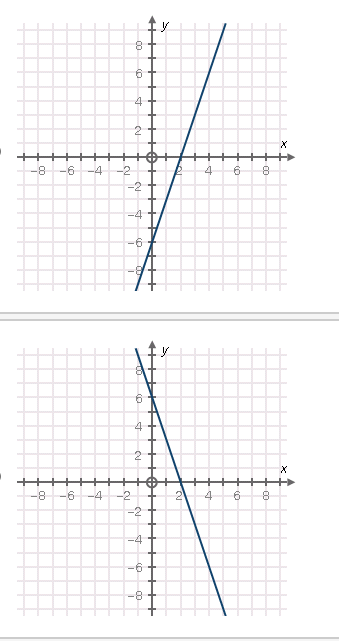
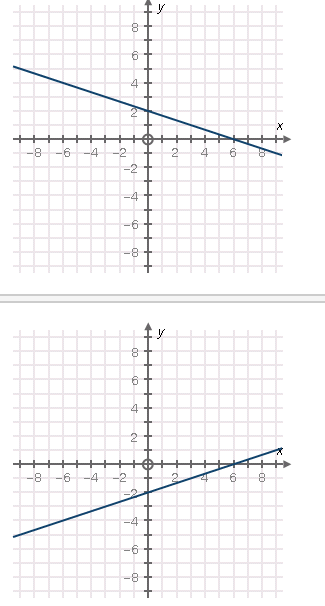
Choose the graph that correctly represents the equation 15x − 5y = 30.
 Gucchi:
@axie
Gucchi:
@smokeybrown
Gucchi:
@tetsxpreme
Gucchi:
am i right with D? or is it C?
 SmokeyBrown:
It wouldn't be graphs C or D. For both of those graphs, when X=6, Y=0; if you plug those values into the equation, you get 15*6 - 5*0 = 30, which isn't true. I think you'd want to go with graph A. For that graph, when X=2, Y=0, and when X=0, Y=-6; plug those values into the equation to get 15*2 - 5*0 = 30 and 15*0 - 5*-6 = 30, which are both true; this also works for any other value of X and Y on the line, they will always return the correct result when you plug them into the equation like that. Another way to solve the problem would be to use algebra to convert the equation into the form y=mx+b, which would make it easy to see what kind of graph you want based on the slope and y-intercept. Either way, I think graph A would be the answer you want
 Joe348:
i probably can help
Joe348:
you would want to rearrange your problem
Gucchi:
Gucchi:
@smokeybrown
 Gucchi:
ty i get this now
Joe348:
so -5y+15x=30
Joe348:
divide everything by -5 so that would be y=-3x-6
Joe348:
divide everything by -5 so that would be y=-3x-6
Join our real-time social learning platform and learn together with your friends!
 Twaylor:
Time flies doesn't it? I tried to not be the second squeaky wheel of the household and ended up hurting myself and others severely.
Twaylor:
Time flies doesn't it? I tried to not be the second squeaky wheel of the household and ended up hurting myself and others severely.
 clllaaaaaire:
any tips? the quality isn't the best because I am using this site on my computer
clllaaaaaire:
any tips? the quality isn't the best because I am using this site on my computer
 Midnight97:
Kinda a roleplay story between me and my friend enjoy... Part one Forgive me for all the screenshots.
Midnight97:
Kinda a roleplay story between me and my friend enjoy... Part one Forgive me for all the screenshots.
 StevenisGhost:
what type of song should I make next, and will y'all go check out my new song on
Midnight97:
My drawing sure changed over the years look at these two pictures from 2024 to no
StevenisGhost:
what type of song should I make next, and will y'all go check out my new song on
Midnight97:
My drawing sure changed over the years look at these two pictures from 2024 to no
 EdwinJsHispanic:
"poem" love is So Beautiful to have. But it's so hard to have. At this point I don't know whether its worth the wait Or if it's just millions of miles to re
EdwinJsHispanic:
"poem" love is So Beautiful to have. But it's so hard to have. At this point I don't know whether its worth the wait Or if it's just millions of miles to re
EdwinJsHispanic:
"poem" love is So Beautiful to have. But it's so hard to have. At this point I don't know whether its worth the wait Or if it's just millions of miles to re
EdwinJsHispanic:
"poem" love is So Beautiful to have. But it's so hard to have. At this point I don't know whether its worth the wait Or if it's just millions of miles to re
 Breathless:
I don't know if this would be considered art, but its close enough I believe, Any
Breathless:
I don't know if this would be considered art, but its close enough I believe, Any