Marcus plots the point (4, 7) in Quadrant I on the coordinate plane. Nicole then plots the point (4, –3) in Quadrant IV of the same graph. Explain what the line that goes through those two points would look like, and evaluate the slope.
 MidniteSunny:
alright well wut hav u gotten so far
 AZ:
AZ:
Can you plot the points and draw a line between the two points? |dw:1637297683469:dw|
AZ:
To find the slope, you can use the slope formula \(\Large\text{Slope} = \dfrac{\color{green}{y_2} - \color{orange}{y_1}}{\color{cyan}{x_2}-\color{red}{x_1}}\) where you have two points \(\Large (\color{red}{x_1}, \color{orange}{y_1})\) and \(\Large (\color{cyan}{x_2}, \color{green}{y_2})\)
AZ:
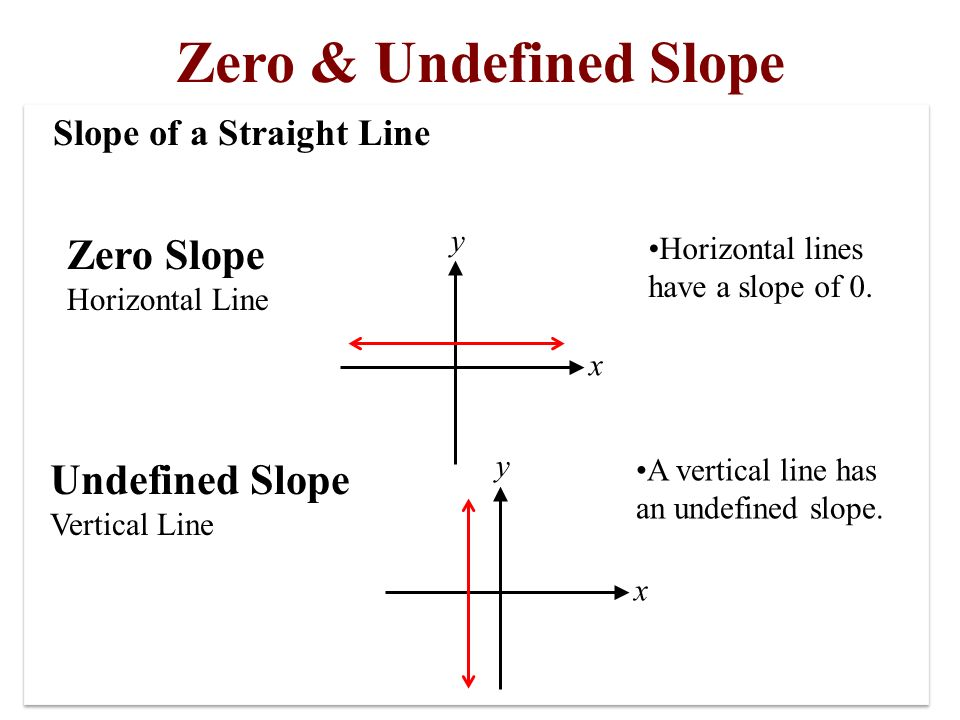
However, there's some general rules you should probably remember about the slope of horizontal or vertical lines:
Join our real-time social learning platform and learn together with your friends!
 Twaylor:
Time flies doesn't it? I tried to not be the second squeaky wheel of the household and ended up hurting myself and others severely.
Twaylor:
Time flies doesn't it? I tried to not be the second squeaky wheel of the household and ended up hurting myself and others severely.
 clllaaaaaire:
any tips? the quality isn't the best because I am using this site on my computer
clllaaaaaire:
any tips? the quality isn't the best because I am using this site on my computer
 Midnight97:
Kinda a roleplay story between me and my friend enjoy... Part one Forgive me for all the screenshots.
Midnight97:
Kinda a roleplay story between me and my friend enjoy... Part one Forgive me for all the screenshots.
 StevenisGhost:
what type of song should I make next, and will y'all go check out my new song on
Midnight97:
My drawing sure changed over the years look at these two pictures from 2024 to no
StevenisGhost:
what type of song should I make next, and will y'all go check out my new song on
Midnight97:
My drawing sure changed over the years look at these two pictures from 2024 to no
 EdwinJsHispanic:
"poem" love is So Beautiful to have. But it's so hard to have. At this point I don't know whether its worth the wait Or if it's just millions of miles to re
EdwinJsHispanic:
"poem" love is So Beautiful to have. But it's so hard to have. At this point I don't know whether its worth the wait Or if it's just millions of miles to re
EdwinJsHispanic:
"poem" love is So Beautiful to have. But it's so hard to have. At this point I don't know whether its worth the wait Or if it's just millions of miles to re
EdwinJsHispanic:
"poem" love is So Beautiful to have. But it's so hard to have. At this point I don't know whether its worth the wait Or if it's just millions of miles to re
 Breathless:
I don't know if this would be considered art, but its close enough I believe, Any
Breathless:
I don't know if this would be considered art, but its close enough I believe, Any