Ask
your own question, for FREE!
Mathematics
8 Online
 UnluckySolaR:
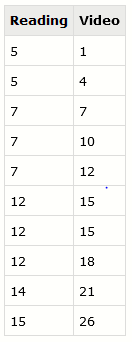
(06.02) The table below shows data from a survey about the amount of time high school students spent reading and the amount of time spent watching videos each week (without reading): Which response best describes outliers in these data sets? (2 points) Neither data set has suspected outliers. The range of data is too small to identify outliers. Video has a suspected outlier in the 26-hour value. Due to the narrow range of reading compared to video, the video values of 18, 21, and 26 are all possible outliers.
Still Need Help?
Join the QuestionCove community and study together with friends!
 UnluckySolaR:
Table^^
UnluckySolaR:
I believe it would be "Neither data set has suspected outliers." But i'm not sure
UnluckySolaR:
Since 26 isn't a huge difference from 18
UnluckySolaR:
@tutorial
Still Need Help?
Join the QuestionCove community and study together with friends!
UnluckySolaR:
@tetsxpreme Help pls
Can't find your answer?
Make a FREE account and ask your own questions, OR help others and earn volunteer hours!
Join our real-time social learning platform and learn together with your friends!
Join our real-time social learning platform and learn together with your friends!
Latest Questions
 natalieee:
who else wants a job in biology? I love biomedical science and want to work with
natalieee:
who else wants a job in biology? I love biomedical science and want to work with
 avisshomes:
What should I look for before choosing a co-living space in Gurgaon?
avisshomes:
What should I look for before choosing a co-living space in Gurgaon?
 Twaylor:
Time flies doesn't it? I tried to not be the second squeaky wheel of the household and ended up hurting myself and others severely.
Twaylor:
Time flies doesn't it? I tried to not be the second squeaky wheel of the household and ended up hurting myself and others severely.
 clllaaaaaire:
any tips? the quality isn't the best because I am using this site on my computer
clllaaaaaire:
any tips? the quality isn't the best because I am using this site on my computer
 Midnight97:
Kinda a roleplay story between me and my friend enjoy... Part one Forgive me for all the screenshots.
Midnight97:
Kinda a roleplay story between me and my friend enjoy... Part one Forgive me for all the screenshots.
 StevenisGhost:
what type of song should I make next, and will y'all go check out my new song on
Midnight97:
My drawing sure changed over the years look at these two pictures from 2024 to no
StevenisGhost:
what type of song should I make next, and will y'all go check out my new song on
Midnight97:
My drawing sure changed over the years look at these two pictures from 2024 to no
 EdwinJsHispanic:
"poem" love is So Beautiful to have. But it's so hard to have. At this point I don't know whether its worth the wait Or if it's just millions of miles to re
EdwinJsHispanic:
"poem" love is So Beautiful to have. But it's so hard to have. At this point I don't know whether its worth the wait Or if it's just millions of miles to re
EdwinJsHispanic:
"poem" love is So Beautiful to have. But it's so hard to have. At this point I don't know whether its worth the wait Or if it's just millions of miles to re
EdwinJsHispanic:
"poem" love is So Beautiful to have. But it's so hard to have. At this point I don't know whether its worth the wait Or if it's just millions of miles to re
natalieee:
who else wants a job in biology? I love biomedical science and want to work with
48 minutes ago
8 Replies
0 Medals
2 days ago
6 Replies
0 Medals
Twaylor:
Time flies doesn't it? I tried to not be the second squeaky wheel of the household and ended up hurting myself and others severely.
5 days ago
12 Replies
2 Medals
clllaaaaaire:
any tips? the quality isn't the best because I am using this site on my computer
2 weeks ago
2 Replies
0 Medals
Midnight97:
Kinda a roleplay story between me and my friend enjoy... Part one Forgive me for all the screenshots.
3 weeks ago
2 Replies
1 Medal
StevenisGhost:
what type of song should I make next, and will y'all go check out my new song on
2 weeks ago
6 Replies
2 Medals
Midnight97:
My drawing sure changed over the years look at these two pictures from 2024 to no
3 weeks ago
6 Replies
1 Medal
EdwinJsHispanic:
"poem" love is So Beautiful to have. But it's so hard to have. At this point I don't know whether its worth the wait Or if it's just millions of miles to re
3 weeks ago
3 Replies
0 Medals
EdwinJsHispanic:
"poem" love is So Beautiful to have. But it's so hard to have. At this point I don't know whether its worth the wait Or if it's just millions of miles to re
4 weeks ago
0 Replies
0 Medals