 UnluckySolaR:
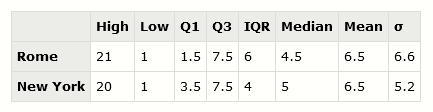
(06.02 MC) The table shows data from a survey about the number of times families eat at restaurants during a week. The families are either from Rome, Italy or New York, New York: Which of the choices below best describes how to measure the center of this data? (5 points) Both centers are best described with the mean. Both centers are best described with the median. The Rome data center is best described by the mean. The New York data center is best described by the median. The Rome data center is best described by the median. The New York data center is best described by the mean.
 UnluckySolaR:
That is the data plot
UnluckySolaR:
I think its C (The Rome data center is best described by the mean. The New York data center is best described by the median.)
UnluckySolaR:
@astrid1 ^^
Join our real-time social learning platform and learn together with your friends!
 Twaylor:
Time flies doesn't it? I tried to not be the second squeaky wheel of the household and ended up hurting myself and others severely.
Twaylor:
Time flies doesn't it? I tried to not be the second squeaky wheel of the household and ended up hurting myself and others severely.
 clllaaaaaire:
any tips? the quality isn't the best because I am using this site on my computer
clllaaaaaire:
any tips? the quality isn't the best because I am using this site on my computer
 Midnight97:
Kinda a roleplay story between me and my friend enjoy... Part one Forgive me for all the screenshots.
Midnight97:
Kinda a roleplay story between me and my friend enjoy... Part one Forgive me for all the screenshots.
 StevenisGhost:
what type of song should I make next, and will y'all go check out my new song on
Midnight97:
My drawing sure changed over the years look at these two pictures from 2024 to no
StevenisGhost:
what type of song should I make next, and will y'all go check out my new song on
Midnight97:
My drawing sure changed over the years look at these two pictures from 2024 to no
 EdwinJsHispanic:
"poem" love is So Beautiful to have. But it's so hard to have. At this point I don't know whether its worth the wait Or if it's just millions of miles to re
EdwinJsHispanic:
"poem" love is So Beautiful to have. But it's so hard to have. At this point I don't know whether its worth the wait Or if it's just millions of miles to re
EdwinJsHispanic:
"poem" love is So Beautiful to have. But it's so hard to have. At this point I don't know whether its worth the wait Or if it's just millions of miles to re
EdwinJsHispanic:
"poem" love is So Beautiful to have. But it's so hard to have. At this point I don't know whether its worth the wait Or if it's just millions of miles to re
 Breathless:
I don't know if this would be considered art, but its close enough I believe, Any
Breathless:
I don't know if this would be considered art, but its close enough I believe, Any