 MsLexus:
can someone help me out with a math question?
MsLexus:
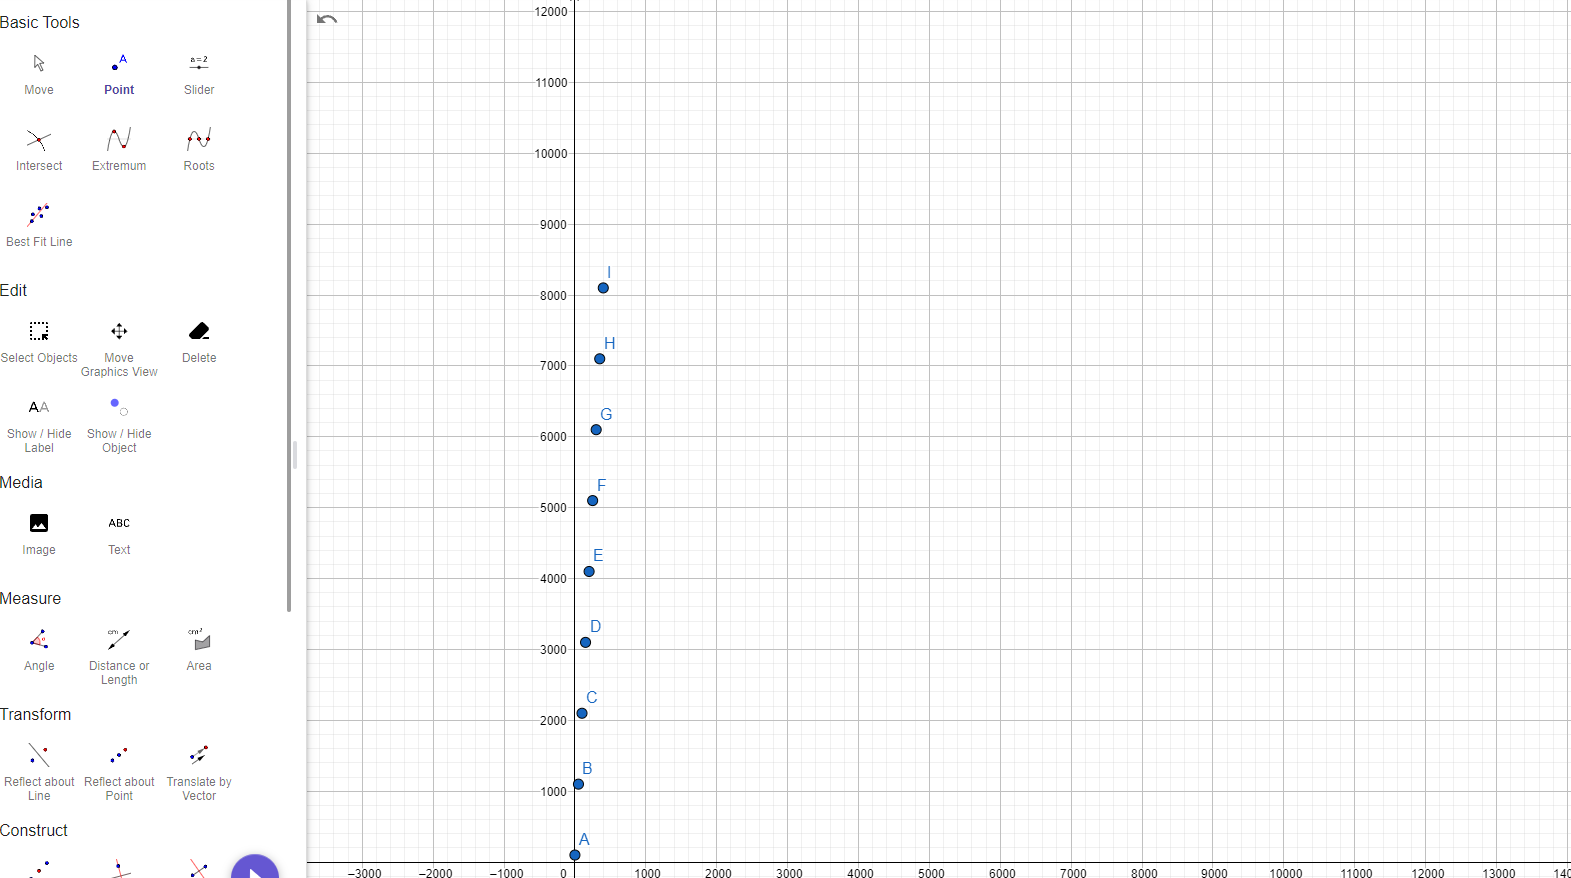
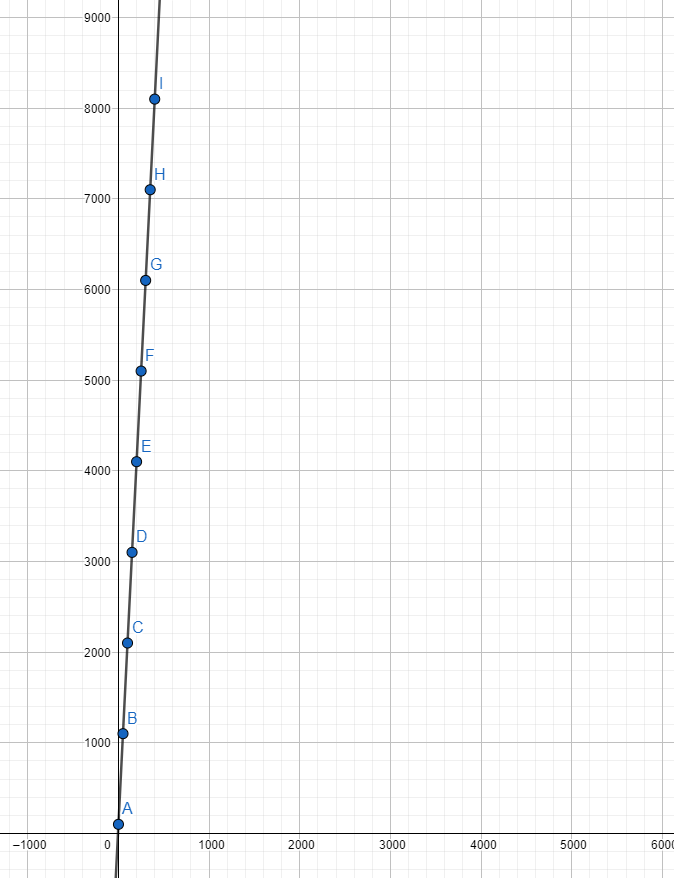
A manager is assessing the correlation between the number of employees in a plant and the number of products produced yearly. The table shows the data: Number of employees (x) 0 50 100 150 200 250 300 350 400 Number of products (y) 100 1,100 2,100 3,100 4,100 5,100 6,100 7,100 8,100 Part A: Is there any correlation between the number of employees in the plant and the number of products produced yearly? Justify your answer. (4 points) Part B: Write a function that best fits the data. (3 points) Part C: What does the slope and y-intercept of the plot indicate? (3 points)
 avacaplot:
this is easy
MsLexus:
im very slow :c
MsLexus:
just cuz somebody hurt your feelings dont mean you gotta take it out on someone who dont even know you
 Hero:
Hero:
Use geogebra to plot the points. And then use the fit plot algorithm.
MsLexus:
MsLexus:
i honestly dont know what im doing on the geogebra website T-T
MsLexus:
oh wait
MsLexus:
i might have gotten how to point the data
Hero:
Okay I can help you out
 MsLexus:
i graphed it i believe it
 MsLexus:
did i do it correct?
Hero:
Looks right.
Hero:
If you know how to generate the link, then I can check it.
Hero:
Also, you need to put the actual point coordinates on the board instead of just alphabet letters.
MsLexus:
Hero:
Yes. You probably don't know how to generate it
MsLexus:
you're right T-T im trying here tho
MsLexus:
i managed to do it
Hero:
Yes, but you need to include all the points in the line fitting
MsLexus:
MsLexus:
i believe i did the question but not correctly
MsLexus:
i need one more question thats completely different from this one
MsLexus:
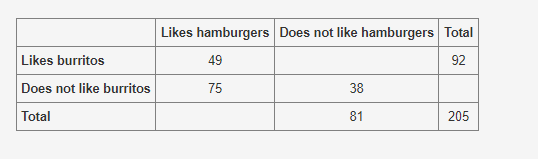
Part C: Use the conditional relative frequencies to determine which data point has strongest association of its two factors. Use complete sentences to explain your answer. (5 points)
 YRJ8498:
Do you Know how to read Frequency Tables?
Join our real-time social learning platform and learn together with your friends!
 Twaylor:
Time flies doesn't it? I tried to not be the second squeaky wheel of the household and ended up hurting myself and others severely.
Twaylor:
Time flies doesn't it? I tried to not be the second squeaky wheel of the household and ended up hurting myself and others severely.
 clllaaaaaire:
any tips? the quality isn't the best because I am using this site on my computer
clllaaaaaire:
any tips? the quality isn't the best because I am using this site on my computer
 Midnight97:
Kinda a roleplay story between me and my friend enjoy... Part one Forgive me for all the screenshots.
Midnight97:
Kinda a roleplay story between me and my friend enjoy... Part one Forgive me for all the screenshots.
 StevenisGhost:
what type of song should I make next, and will y'all go check out my new song on
Midnight97:
My drawing sure changed over the years look at these two pictures from 2024 to no
StevenisGhost:
what type of song should I make next, and will y'all go check out my new song on
Midnight97:
My drawing sure changed over the years look at these two pictures from 2024 to no
 EdwinJsHispanic:
"poem" love is So Beautiful to have. But it's so hard to have. At this point I don't know whether its worth the wait Or if it's just millions of miles to re
EdwinJsHispanic:
"poem" love is So Beautiful to have. But it's so hard to have. At this point I don't know whether its worth the wait Or if it's just millions of miles to re
EdwinJsHispanic:
"poem" love is So Beautiful to have. But it's so hard to have. At this point I don't know whether its worth the wait Or if it's just millions of miles to re
EdwinJsHispanic:
"poem" love is So Beautiful to have. But it's so hard to have. At this point I don't know whether its worth the wait Or if it's just millions of miles to re
 Breathless:
I don't know if this would be considered art, but its close enough I believe, Any
Breathless:
I don't know if this would be considered art, but its close enough I believe, Any