 iosangel:
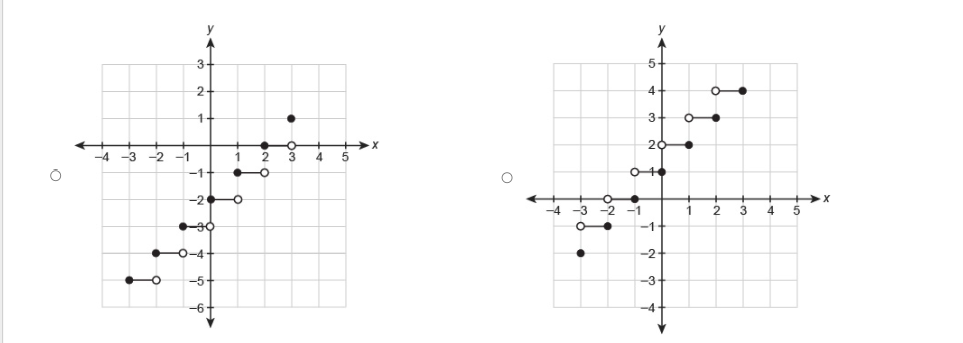
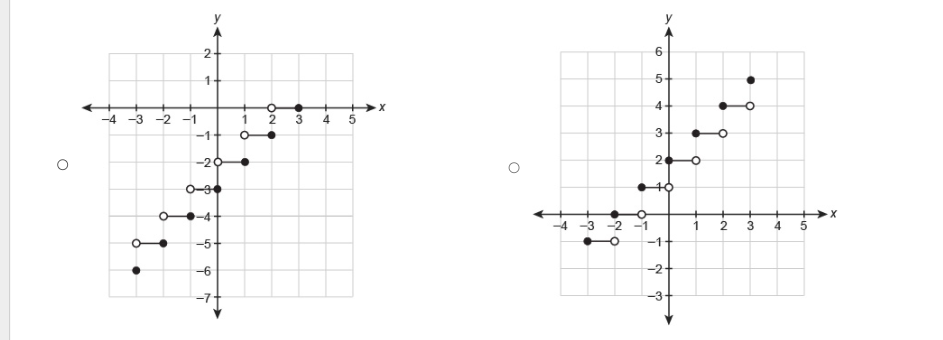
Which graph represents the function over the interval [−3, 3]? f(x)=⌈x⌉−3 Which graph represents the function over the interval [−3, 3]? f(x)=⌈x⌉−3
 iosangel:
I typed it twice on accident
 Macho14:
can you screenshot the question? something seems off to me
iosangel:
Nothing is wrong , this is the question Which graph represents the function over the interval [−3, 3]? f(x)=⌈x⌉−3
Macho14:
wait, never mind, I read it wrong
Macho14:
I am on it
Macho14:
the -3 tells us the graph of the function is shifted 3 units down. so what then would be the answer?
iosangel:
i am not sure whst the brackets mean
Macho14:
oh, I got you now. This function is a greater integer function What is Greatest Integer Function? The greatest integer function is a function that gives the largest integer which is less than or equal to x. This function is denoted by ⌊x⌋. We will round off the given number to the nearest integer that is less than or equal to the number itself.
iosangel:
what
Macho14:
ah, never mind, I will explain this differently:
Macho14:
the ticks mean floor or ceiling function, this is a ceiling function
Macho14:
I know the answer, but look at this link to see if you can figure it out: https://www.analyzemath.com/function/floor_function.html#:~:text=The%20floor%20function%20floor(x,the%20set%20of%20all%20integers.
Macho14:
They asked for what graph it is over the interval [-3,3], so use the given function: x-3=? to give you the answer. first plug in -3 and 3. (-3)-3 = -6 so y must equal -6, 3-3=0, so y must equal 0. the range of the correct function is (-6,0). when you have ceiling functions, every interval begins with an open dot, when you have floor functions, every interval begins with a closed dot
Macho14:
you should be able to get the answer now \[\lceil x \rceil \lfloor x \rfloor\]the former means ceiling function, the latter means floor function. ceil. begins with open dot intervals, floor begins with closed dot intervals
iosangel:
yes, it should be the first one b
Join our real-time social learning platform and learn together with your friends!
 Strawberryluna:
Read my poem. Im not for criticism its a poem I wrote after my breakup: Youu2019ll never understand the way you made me break, I hate that I still love you
Strawberryluna:
Read my poem. Im not for criticism its a poem I wrote after my breakup: Youu2019ll never understand the way you made me break, I hate that I still love you
 Bounty:
first poem in a min- (tittle)? one moment i'm fine I smile till my face burns I laugh till I cant breath Then I cry I wonder where I went wrong I listen to
Bounty:
first poem in a min- (tittle)? one moment i'm fine I smile till my face burns I laugh till I cant breath Then I cry I wonder where I went wrong I listen to
 Twaylor:
3d printing a glider (for 150 pound 5'8 person - prolly should make it for up to
Twaylor:
3d printing a glider (for 150 pound 5'8 person - prolly should make it for up to
 cullenn:
pitter patter sound of rain gently tapping my window tonight. calming, soothing, right? not for me.
cullenn:
pitter patter sound of rain gently tapping my window tonight. calming, soothing, right? not for me.

 Arriyanalol:
DON'T BUY TICKETS TO SEAWORLD i watched a documentary on seaworld and its sad wha
Arriyanalol:
DON'T BUY TICKETS TO SEAWORLD i watched a documentary on seaworld and its sad wha
 natalieee:
who else wants a job in biology? I love biomedical science and want to work with
Twaylor:
Time flies doesn't it? I tried to not be the second squeaky wheel of the household and ended up hurting myself and others severely.
natalieee:
who else wants a job in biology? I love biomedical science and want to work with
Twaylor:
Time flies doesn't it? I tried to not be the second squeaky wheel of the household and ended up hurting myself and others severely.
 clllaaaaaire:
any tips? the quality isn't the best because I am using this site on my computer
clllaaaaaire:
any tips? the quality isn't the best because I am using this site on my computer