 imurbbygirl12345:
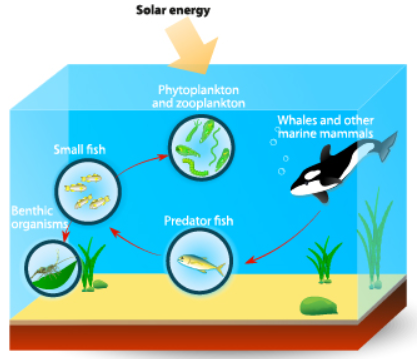
Help! In this marine food web, the small fish is the prey for the predator fish. Currently, humans are harvesting large numbers of the small fish for food. Which graph correctly depicts the likely effect of the harvesting on the predator fish population?
 Vocaloid:
we would need to see the graphs to answer this completely, but if humans are harvesting a lot of the small fish, and the predator fish eat the small fish to survive, then we would expect some kind of decrease in the predator population
 Vocaloid:
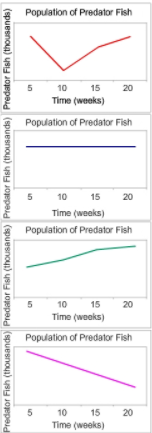
so, going along with what I said, which graph shows a significant decrease in the predator population?
imurbbygirl12345:
The first one or both
Vocaloid:
Hm, that’s a good guess, but if the people just keep fishing without stopping we would just expect the population to keep decreasing without returning to previous levels I’d say the last graph, which sharply decreases without increasing, would be a better fit
imurbbygirl12345:
Join our real-time social learning platform and learn together with your friends!
 Twaylor:
Time flies doesn't it? I tried to not be the second squeaky wheel of the household and ended up hurting myself and others severely.
Twaylor:
Time flies doesn't it? I tried to not be the second squeaky wheel of the household and ended up hurting myself and others severely.
 clllaaaaaire:
any tips? the quality isn't the best because I am using this site on my computer
clllaaaaaire:
any tips? the quality isn't the best because I am using this site on my computer
 Midnight97:
Kinda a roleplay story between me and my friend enjoy... Part one Forgive me for all the screenshots.
Midnight97:
Kinda a roleplay story between me and my friend enjoy... Part one Forgive me for all the screenshots.
 StevenisGhost:
what type of song should I make next, and will y'all go check out my new song on
Midnight97:
My drawing sure changed over the years look at these two pictures from 2024 to no
StevenisGhost:
what type of song should I make next, and will y'all go check out my new song on
Midnight97:
My drawing sure changed over the years look at these two pictures from 2024 to no
 EdwinJsHispanic:
"poem" love is So Beautiful to have. But it's so hard to have. At this point I don't know whether its worth the wait Or if it's just millions of miles to re
EdwinJsHispanic:
"poem" love is So Beautiful to have. But it's so hard to have. At this point I don't know whether its worth the wait Or if it's just millions of miles to re
EdwinJsHispanic:
"poem" love is So Beautiful to have. But it's so hard to have. At this point I don't know whether its worth the wait Or if it's just millions of miles to re
EdwinJsHispanic:
"poem" love is So Beautiful to have. But it's so hard to have. At this point I don't know whether its worth the wait Or if it's just millions of miles to re
 Breathless:
I don't know if this would be considered art, but its close enough I believe, Any
Breathless:
I don't know if this would be considered art, but its close enough I believe, Any