 IiIxci:
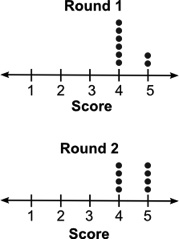
The dot plots below show the scores for a group of students for two rounds of a quiz: Two dot plots are shown one below the other. The title for the dot plot on the top is Round 1 and the title for the bottom plot is Round 2. Below the line for each dot plot is written Score. There are markings from 1 to 5 on the line at intervals of one. There are there are 6 dots above the mark 4 and there are 2 dots above the mark 5.For the bottom dot plot there are there are 4 dots above the mark 4 and there are 4 dots above the mark 5. Which of the following inferences can be made using the dot plots? There is no overlap between the data. The range of each round is the same. Round 1 scores are higher than round 2 scores. Round 2 scores are lower than round 1 scores.
 xXSemiloredeznutzxX:
do u have a pic?
 IiIxci:
nvm, figured it out
IiIxci:
it was b ( The range of each round is the same.)
Join our real-time social learning platform and learn together with your friends!
 Strawberryluna:
Read my poem. Im not for criticism its a poem I wrote after my breakup: Youu2019ll never understand the way you made me break, I hate that I still love you
Strawberryluna:
Read my poem. Im not for criticism its a poem I wrote after my breakup: Youu2019ll never understand the way you made me break, I hate that I still love you
 Bounty:
first poem in a min- (tittle)? one moment i'm fine I smile till my face burns I laugh till I cant breath Then I cry I wonder where I went wrong I listen to
Bounty:
first poem in a min- (tittle)? one moment i'm fine I smile till my face burns I laugh till I cant breath Then I cry I wonder where I went wrong I listen to
 Twaylor:
3d printing a glider (for 150 pound 5'8 person - prolly should make it for up to
Twaylor:
3d printing a glider (for 150 pound 5'8 person - prolly should make it for up to
 cullenn:
pitter patter sound of rain gently tapping my window tonight. calming, soothing, right? not for me.
cullenn:
pitter patter sound of rain gently tapping my window tonight. calming, soothing, right? not for me.

 Arriyanalol:
DON'T BUY TICKETS TO SEAWORLD i watched a documentary on seaworld and its sad wha
Arriyanalol:
DON'T BUY TICKETS TO SEAWORLD i watched a documentary on seaworld and its sad wha
 natalieee:
who else wants a job in biology? I love biomedical science and want to work with
Twaylor:
Time flies doesn't it? I tried to not be the second squeaky wheel of the household and ended up hurting myself and others severely.
natalieee:
who else wants a job in biology? I love biomedical science and want to work with
Twaylor:
Time flies doesn't it? I tried to not be the second squeaky wheel of the household and ended up hurting myself and others severely.
 clllaaaaaire:
any tips? the quality isn't the best because I am using this site on my computer
clllaaaaaire:
any tips? the quality isn't the best because I am using this site on my computer