 IiIxci:
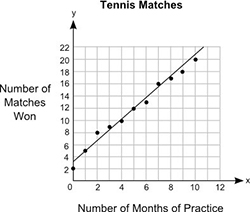
(Picture below) The graph below shows the relationship between the number of months different students practiced tennis and the number of matches they won: The title of the graph is Tennis Matches. On x axis, the label is Number of Months of Practice. On y axis, the label is Number of Matches Won. The scale on the y axis is from 0 to 22 at increments of 2, and the scale on the x axis is from 0 to 12 at increments of 2. The points plotted on the graph are the ordered pairs 0, 2 and 1, 5 and 2, 8 and 3, 9 and 4, 10 and 5, 12 and 6, 13 and 7, 16 and 8,17 and 9, 18 and 10,20. A straight line is drawn joining the ordered pairs 0, 3.3 and 2, 6.8 and 4, 10 and 6, 13.5 and 8, 17 and 10, 20.5. Part A: What is the approximate y-intercept of the line of best fit and what does it represent? (5 points) Part B: Write the equation for the line of best fit in the slope-intercept form and use it to predict the number of matches that could be won after 13 months of practice. Show your work and include the points used to calculate the slope. (5 points)
Join our real-time social learning platform and learn together with your friends!
 TJH:
love Love, it comes, it goes But what if it stayed stayed in the silence the storm stayed when the world was loud for me it's different; it left when it was
TJH:
love Love, it comes, it goes But what if it stayed stayed in the silence the storm stayed when the world was loud for me it's different; it left when it was
 Puffer:
General question what came first the chicken or the egg itu2019s a trick question
Puffer:
General question what came first the chicken or the egg itu2019s a trick question
 Bounty:
the world keeps moving fast and I'm stuck in a time lapse all I need is a minute
Bounty:
can I get so tips on how to start my journey into semi-realism art also on how to
Bounty:
the world keeps moving fast and I'm stuck in a time lapse all I need is a minute
Bounty:
can I get so tips on how to start my journey into semi-realism art also on how to
 Strawberryluna:
Read my poem. Im not for criticism its a poem I wrote after my breakup: Youu2019ll never understand the way you made me break, I hate that I still love you
Bounty:
first poem in a min- (tittle)? one moment i'm fine I smile till my face burns I laugh till I cant breath Then I cry I wonder where I went wrong I listen to
Strawberryluna:
Read my poem. Im not for criticism its a poem I wrote after my breakup: Youu2019ll never understand the way you made me break, I hate that I still love you
Bounty:
first poem in a min- (tittle)? one moment i'm fine I smile till my face burns I laugh till I cant breath Then I cry I wonder where I went wrong I listen to
 Twaylor:
3d printing a glider (for 150 pound 5'8 person - prolly should make it for up to
Twaylor:
3d printing a glider (for 150 pound 5'8 person - prolly should make it for up to