 JustBeNice:
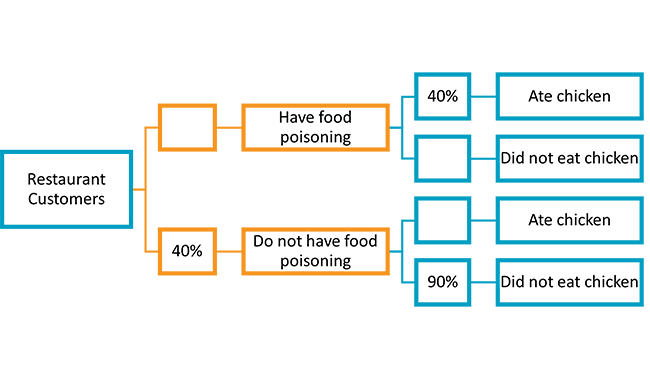
After many phone calls from customers who had dined at a restaurant the previous day, the management team wanted to determine the source of an outbreak of food poisoning. They called all 300 people who had dined that day and found that 40% of the customers did not have food poisoning, of which 90% did not eat chicken. The data also determined that of those who had food poisoning, 40% ate chicken. The following tree diagram shows the conditional relative frequencies. I believe I know the answer, I just need someone to lmk if I am doing this correctly.
i do not have a family
JustBeNice:
I'm sorry..that's unfortunate?
thanks
 BlankSpace:
💀💀💀
JustBeNice:
To find my answer, I calculated how much in number (instead of percentage) how much each catagory had. From that I found that the "ate chicken" catagory had 72 from "have food poisoning" and 12 from "do not have food poisoning". I then added those and calculated the percentage over 300. I got 28%
JustBeNice:
Did I do this correctly?
JustBeNice:
Provided answers: 24%, 28%, 40%, and 50%
JustBeNice:
What?
 b1az34:
?
stop gang stalkin
JustBeNice:
Who? what??
b1az34:
im sorry the voices in my head are just convincing me that you guys are against me and are trying to take advantage of me nnh...
JustBeNice:
I just need help with the question:\ I think I am correct with it. I just need someone to correct me if I'm wrong.
b1az34:
idk the answer
b1az34:
then say that
b1az34:
i swear ama kill this girl
im a tweedle actually
JustBeNice:
Could my post stop being used as a chat please? I'm sorry, but I am in an exam and just need some help. If anyone can help, it would be much appreciated.
JustBeNice:
If no one can help, I'll just close out the question and hope I have it right.
u have to pray to carti and hopefully get the answer right
b1az34:
JustBeNice:
Thank you, b1az34. I'll just stick with my answer I guess.
 Tyrun:
?
Join our real-time social learning platform and learn together with your friends!
 Twaylor:
Time flies doesn't it? I tried to not be the second squeaky wheel of the household and ended up hurting myself and others severely.
Twaylor:
Time flies doesn't it? I tried to not be the second squeaky wheel of the household and ended up hurting myself and others severely.
 clllaaaaaire:
any tips? the quality isn't the best because I am using this site on my computer
clllaaaaaire:
any tips? the quality isn't the best because I am using this site on my computer
 Midnight97:
Kinda a roleplay story between me and my friend enjoy... Part one Forgive me for all the screenshots.
Midnight97:
Kinda a roleplay story between me and my friend enjoy... Part one Forgive me for all the screenshots.
 StevenisGhost:
what type of song should I make next, and will y'all go check out my new song on
Midnight97:
My drawing sure changed over the years look at these two pictures from 2024 to no
StevenisGhost:
what type of song should I make next, and will y'all go check out my new song on
Midnight97:
My drawing sure changed over the years look at these two pictures from 2024 to no
 EdwinJsHispanic:
"poem" love is So Beautiful to have. But it's so hard to have. At this point I don't know whether its worth the wait Or if it's just millions of miles to re
EdwinJsHispanic:
"poem" love is So Beautiful to have. But it's so hard to have. At this point I don't know whether its worth the wait Or if it's just millions of miles to re
EdwinJsHispanic:
"poem" love is So Beautiful to have. But it's so hard to have. At this point I don't know whether its worth the wait Or if it's just millions of miles to re
EdwinJsHispanic:
"poem" love is So Beautiful to have. But it's so hard to have. At this point I don't know whether its worth the wait Or if it's just millions of miles to re
 Breathless:
I don't know if this would be considered art, but its close enough I believe, Any
Breathless:
I don't know if this would be considered art, but its close enough I believe, Any