 Lars:
Lars:
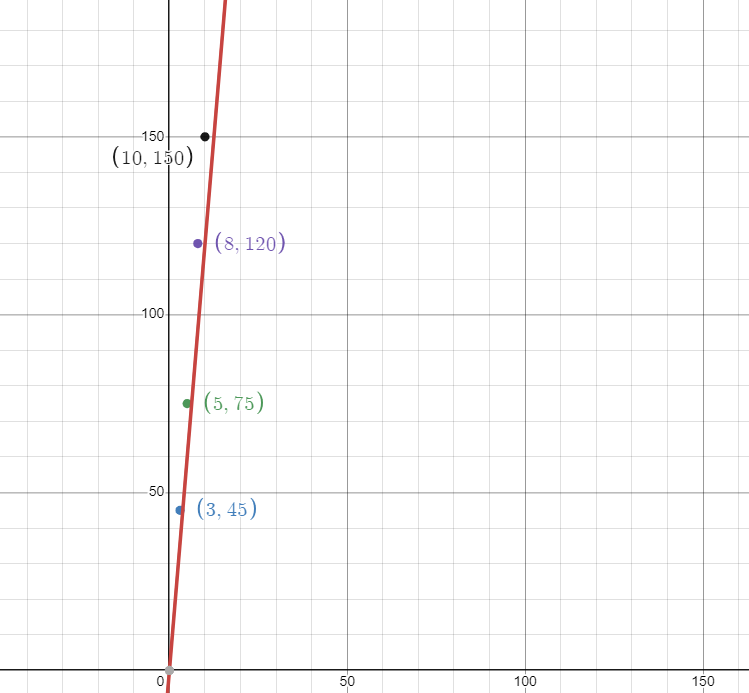
Can someone please graph this for me? The equation y = 12x describes the amount of money Louis earns, where x is the number of hours he works, and y is the amount of money he earns. The table shows the amount of money Carl earns for different numbers of hours worked. Carl’s Earnings Time (h) 3, 5, 8, 10 Money earned ($) 45, 75, 120, 150 Draw a graph that represents their earnings over time in hours. Make sure to label the axis. Remember: there should be two lines, one for Louis and one for Carl. Hint: You may need to create new tables in order to get new coordinates.
 Laylalyssa:
To plot a point its (x,y) so if you have the x values and the y values you can create the coordinates x= time y= money on a graph the y is the vertical line and the x is the horizontal line so the coordinates will be (3,45) (5,75) (8,120) (10,150)
Laylalyssa:
do you know how to plot points on a graph?
Laylalyssa:
@lars
Lars:
I don't know how, I'm just learning this
 Laylalyssa:
the red one represents louis the other one represents the other guy
Lars:
Ohh okay, thank you. What parts are needed to be labeled on the x and y graph?
Lars:
Like, at the sides and then very bottom
Laylalyssa:
wdym?
Laylalyssa:
i labeled the coordinates
Lars:
I mean, on the y axis should I label "money earned" and then on the x axis "time/hours" ?
Laylalyssa:
Laylalyssa:
theres your answer
Lars:
Laylalyssa:
ofc
Join our real-time social learning platform and learn together with your friends!

 Twaylor:
Time flies doesn't it? I tried to not be the second squeaky wheel of the household and ended up hurting myself and others severely.
Twaylor:
Time flies doesn't it? I tried to not be the second squeaky wheel of the household and ended up hurting myself and others severely.
 clllaaaaaire:
any tips? the quality isn't the best because I am using this site on my computer
clllaaaaaire:
any tips? the quality isn't the best because I am using this site on my computer
 Midnight97:
Kinda a roleplay story between me and my friend enjoy... Part one Forgive me for all the screenshots.
Midnight97:
Kinda a roleplay story between me and my friend enjoy... Part one Forgive me for all the screenshots.
 StevenisGhost:
what type of song should I make next, and will y'all go check out my new song on
Midnight97:
My drawing sure changed over the years look at these two pictures from 2024 to no
StevenisGhost:
what type of song should I make next, and will y'all go check out my new song on
Midnight97:
My drawing sure changed over the years look at these two pictures from 2024 to no
 EdwinJsHispanic:
"poem" love is So Beautiful to have. But it's so hard to have. At this point I don't know whether its worth the wait Or if it's just millions of miles to re
EdwinJsHispanic:
"poem" love is So Beautiful to have. But it's so hard to have. At this point I don't know whether its worth the wait Or if it's just millions of miles to re
EdwinJsHispanic:
"poem" love is So Beautiful to have. But it's so hard to have. At this point I don't know whether its worth the wait Or if it's just millions of miles to re
EdwinJsHispanic:
"poem" love is So Beautiful to have. But it's so hard to have. At this point I don't know whether its worth the wait Or if it's just millions of miles to re