 Phantomdex:
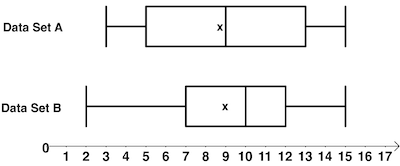
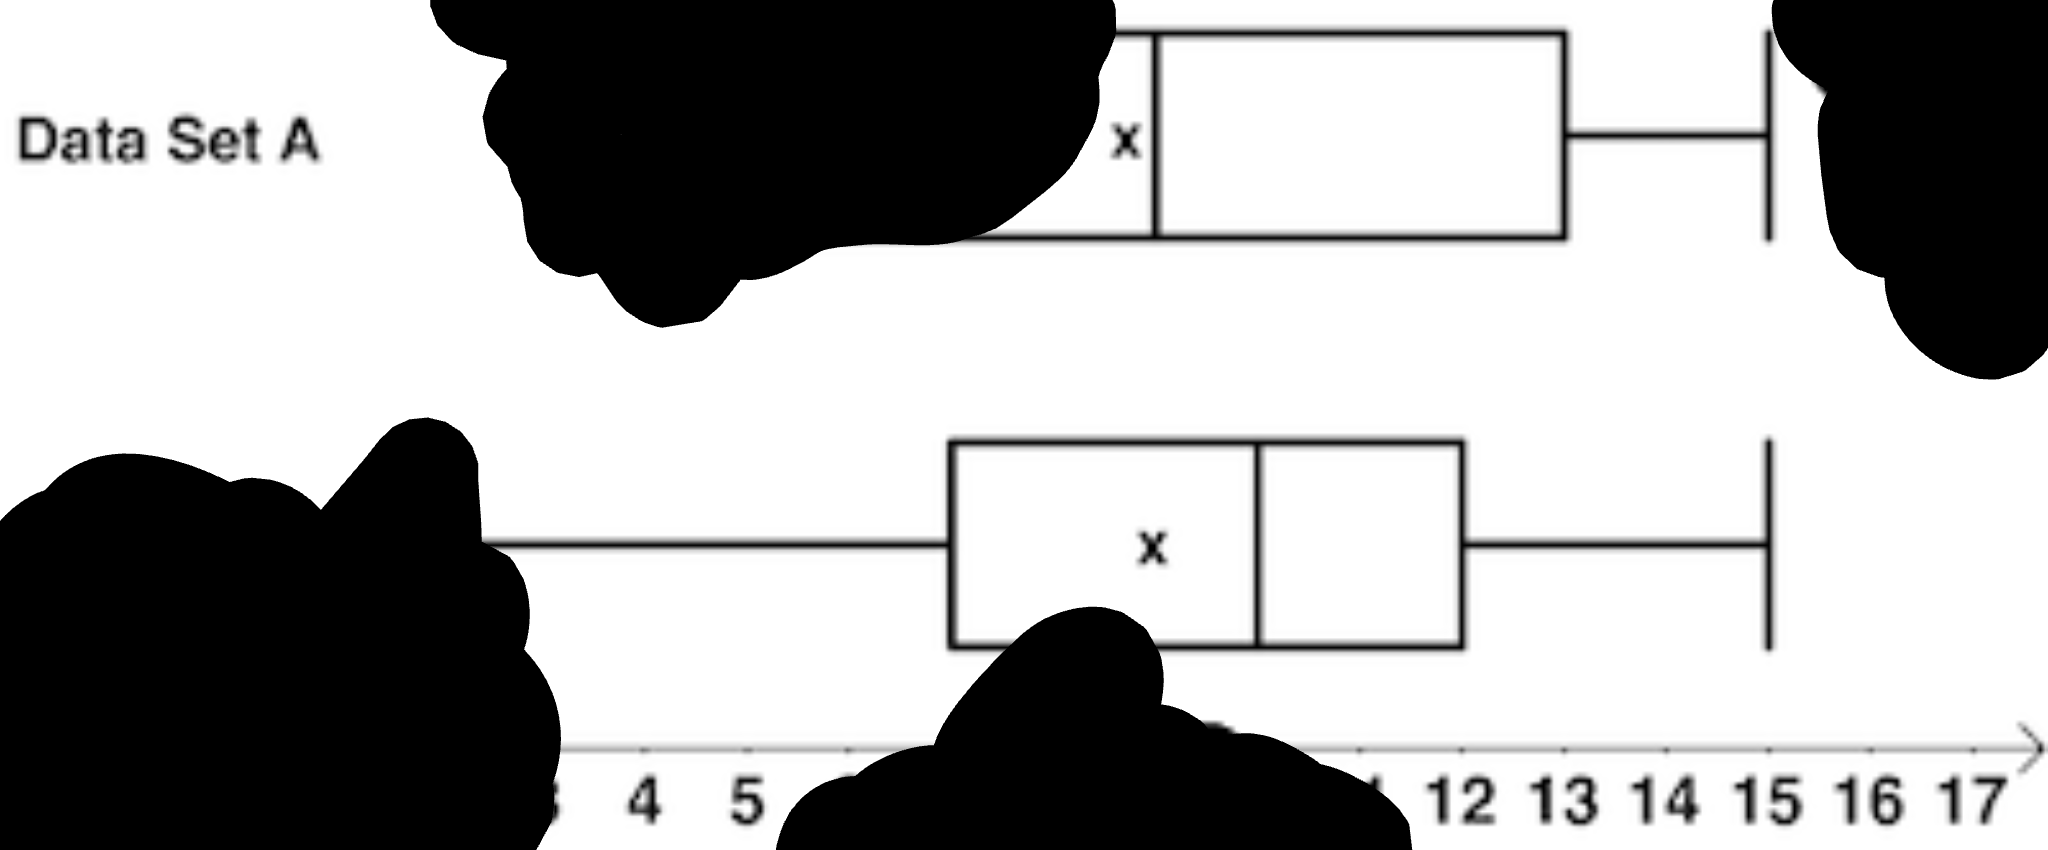
Data were gathered from two groups and displayed in the stacked box plots. Two horizontal box plots are labeled Data Set A and Data Set B. Data Set A shows first vertical segment at 3 and second segment at 5 and the third at 9 and the fourth at 13 and the last at 15 with an x placed at approximately 8.8. Data Set B shows first vertical segment at 2 and second segment at 7 and the third at 10 and the fourth at 12 and the last at 15 with an x placed at approximately 9. Compare the appropriate measures of center and variability for the two sets of data. Data Set A has a lower mean value of 8.8, and Data Set B has a greater range value of 13. Data Set A has a higher median value of 9, and Data Set B has a greater IQR value of 5. Data Set A has a lower median value of 9, and Data Set B has a lower IQR value of 5. Data Set A has a higher mean value of 8.8, and Data Set B has a lower range of value of 13.
 zombieblud:
*eats math problem* nom nom nom
Phantomdex:
Oop-
Phantomdex:
 Midnight97:
zombieblud:
Midnight97:
Let's see what I can do
Phantomdex:
Midnight97:
Phantomdex:
Thank you
Midnight97:
So.. a box plot is a standardized way of displaying the distribution of data based on a five-number summary: minimum, first quartile (Q1), median, third quartile (Q3), and maximum, as you can see in our box plot above
zombieblud:
 Phantomdex:
Midnight97:
As a reminder: - The median is the middle value when a data set is ordered from least to greatest - The range is the difference between the maximum and minimum data values. - The interquartile range (IQR) is the difference between Q3 and Q1 and represents the middle 50% of the data. - The "x" in the box plot typically represents the mean, which is the average of all data points
zombieblud:
 snowie:
zombieblud:
Midnight97:
snowie:
snowie:
Phantomdex:
Midnight97:
So looking at the two plots... which one has a higher median? It's going to be the line in the middle of the box and whichever one is further to the right will be considered higher so which data set has the line in the box that's further to the right. Soo...
Midnight97:
Dang I feel like a nerd now lol
zombieblud:
Midnight97:
Phantomdex:
So...would it be C then? Since that talks about the median and IQR?
zombieblud:
Midnight97:
Phantomdex:
So C it is then
Midnight97:
Data set A's line lines up with 9 Data set B's line line up with 10
Midnight97:
So that means Data Set B has a higher median value of 10 another way to put that is that Data Set A has a lower median value of 9 another way to put that is that Data Set A has a lower median value of 9 which would be option C :)
Midnight97:
I made sure it was C
Phantomdex:
Right and because its skewed it can't be range so it'd have to be IQR!
Join our real-time social learning platform and learn together with your friends!
 Twaylor:
Time flies doesn't it? I tried to not be the second squeaky wheel of the household and ended up hurting myself and others severely.
Twaylor:
Time flies doesn't it? I tried to not be the second squeaky wheel of the household and ended up hurting myself and others severely.
 clllaaaaaire:
any tips? the quality isn't the best because I am using this site on my computer
clllaaaaaire:
any tips? the quality isn't the best because I am using this site on my computer
 Midnight97:
Kinda a roleplay story between me and my friend enjoy... Part one Forgive me for all the screenshots.
Midnight97:
Kinda a roleplay story between me and my friend enjoy... Part one Forgive me for all the screenshots.
 StevenisGhost:
what type of song should I make next, and will y'all go check out my new song on
Midnight97:
My drawing sure changed over the years look at these two pictures from 2024 to no
StevenisGhost:
what type of song should I make next, and will y'all go check out my new song on
Midnight97:
My drawing sure changed over the years look at these two pictures from 2024 to no
 EdwinJsHispanic:
"poem" love is So Beautiful to have. But it's so hard to have. At this point I don't know whether its worth the wait Or if it's just millions of miles to re
EdwinJsHispanic:
"poem" love is So Beautiful to have. But it's so hard to have. At this point I don't know whether its worth the wait Or if it's just millions of miles to re
EdwinJsHispanic:
"poem" love is So Beautiful to have. But it's so hard to have. At this point I don't know whether its worth the wait Or if it's just millions of miles to re
EdwinJsHispanic:
"poem" love is So Beautiful to have. But it's so hard to have. At this point I don't know whether its worth the wait Or if it's just millions of miles to re
 Breathless:
I don't know if this would be considered art, but its close enough I believe, Any
Breathless:
I don't know if this would be considered art, but its close enough I believe, Any