 Subshilava:
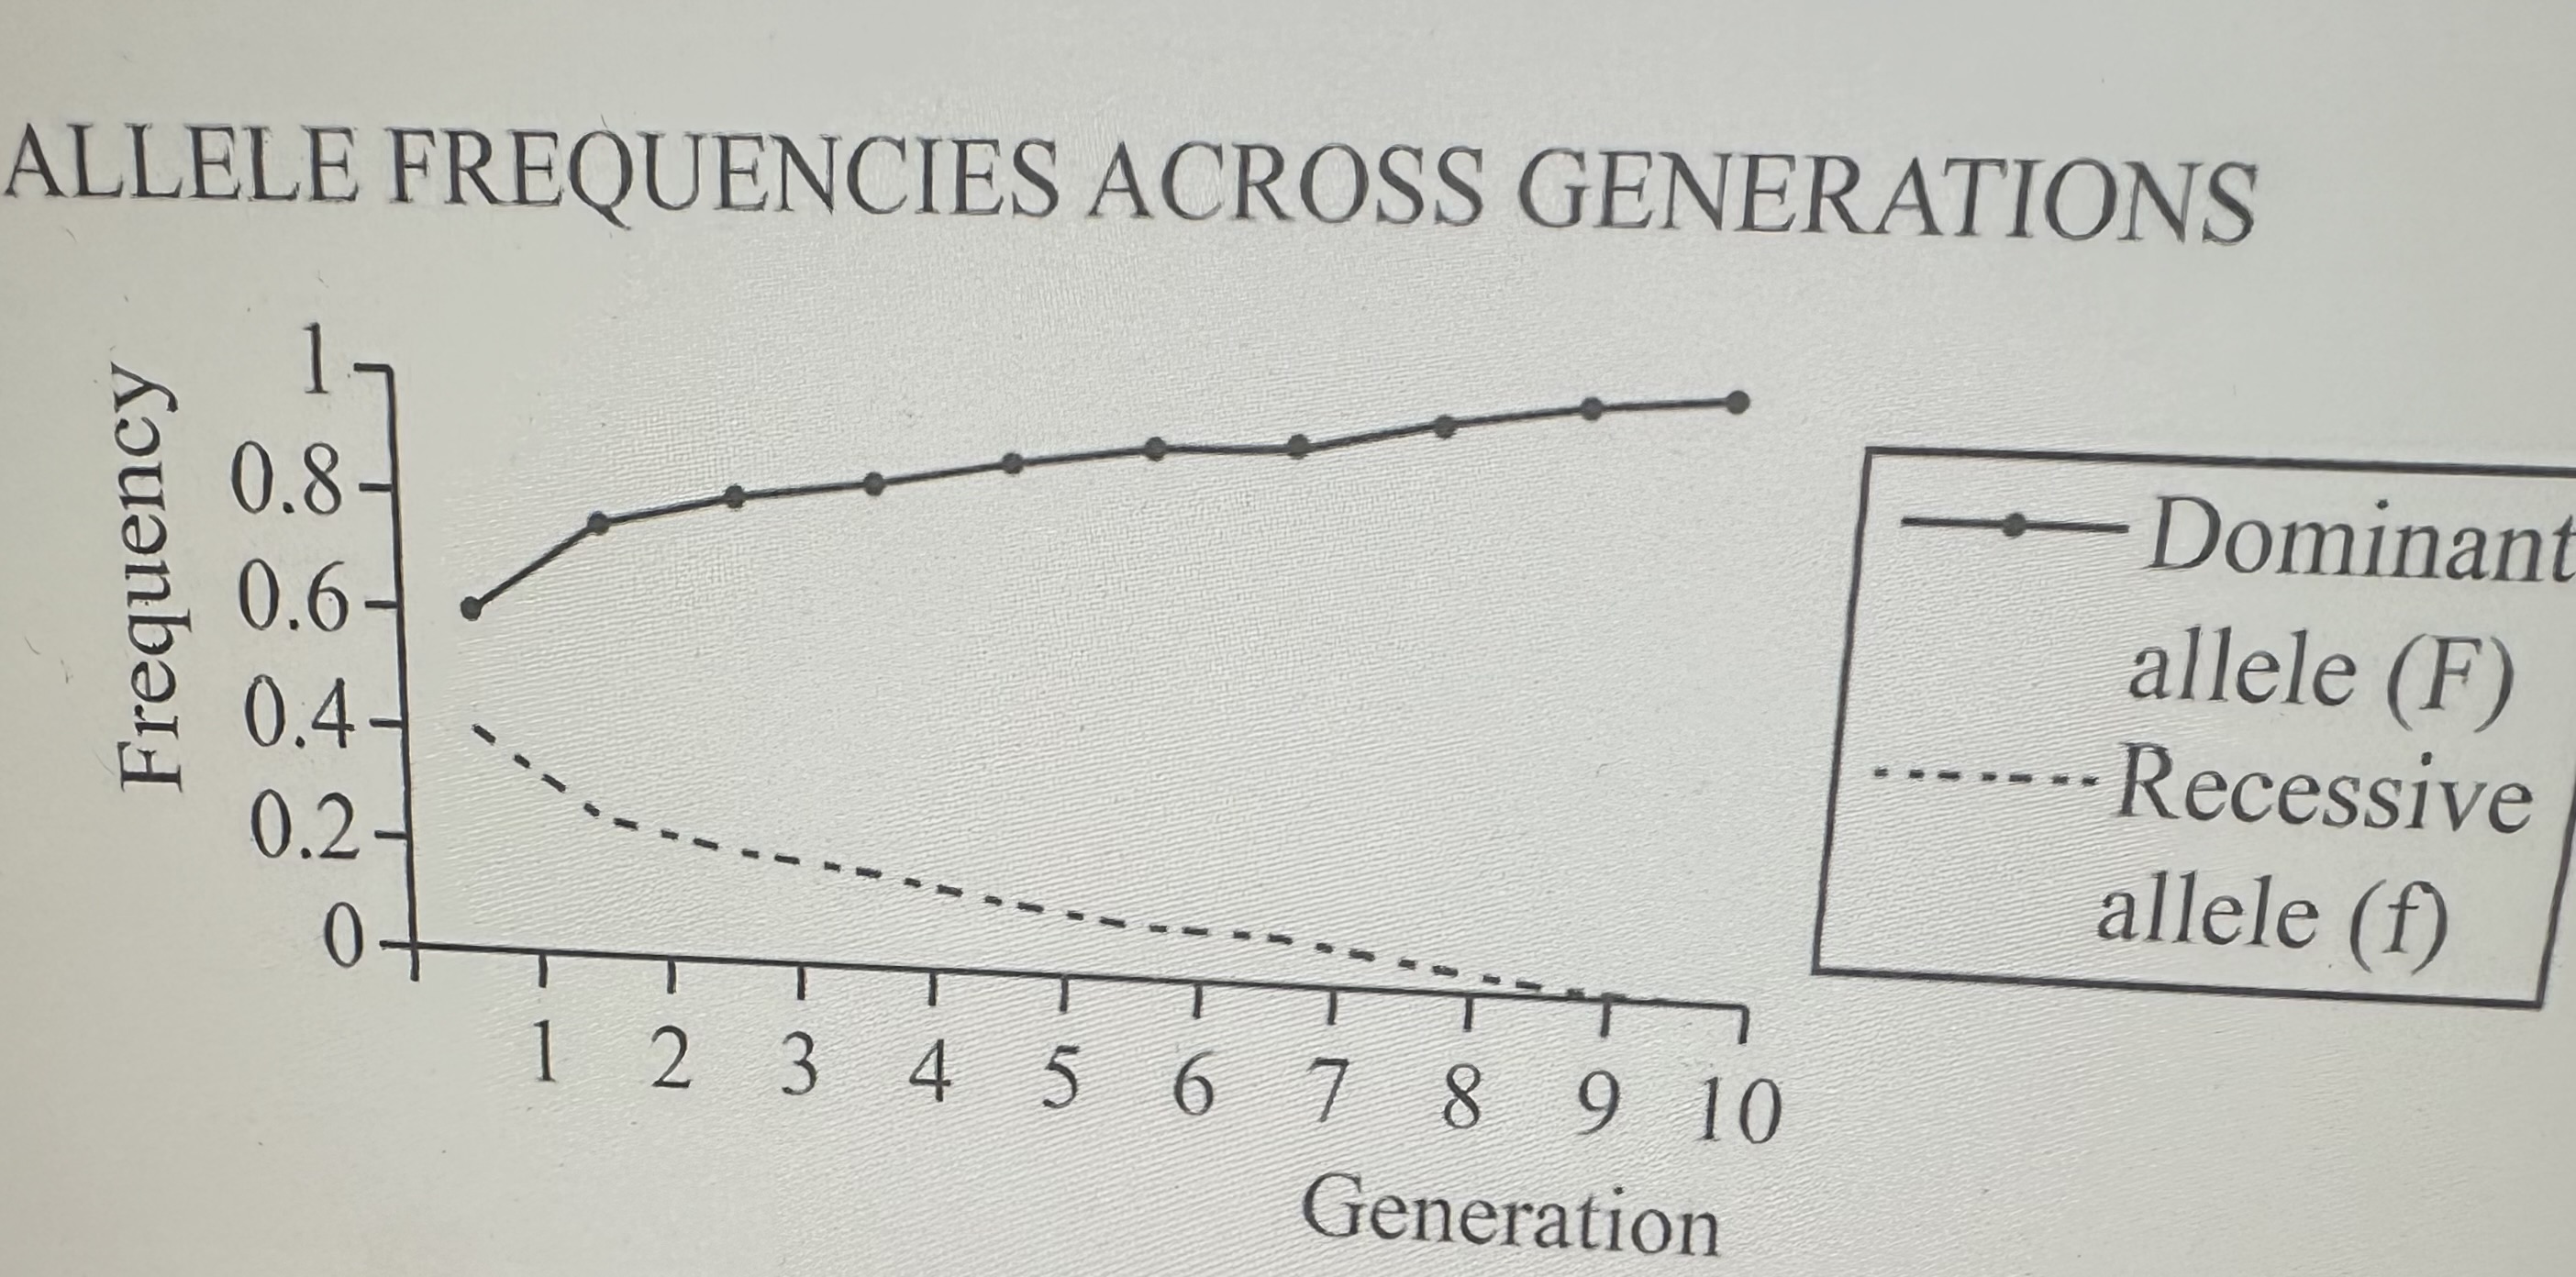
Which of the following statements is supported by the graph below? 1 0.8- 0.6- 0.4- 0.2- 0- 1 2 3 4 5 6 7 8 Dominant allele (F) Recessive allele (f) Frequency 9 Generation 10 Oa The population is in Hardy-Weinberg equilibrium, as the sum of the frequency of the dominant allele and the recessive allele is always equal to 1 The percentage of individuals homozygous recessive for this particular trait is increasing over time Selection has caused frequencies to change over time because individuals with a dominant allele survive at higher rates than Oc Individuals with recessive alleles Od Individuals who are homozygous recessive for this particular trait have migrated into the population, causing the frequency to approach 1
 gingy57016:
it should be 0.2- if I'm correct
Subshilava:
A b c or d?
gingy57016:
A hardy-weinberg
Join our real-time social learning platform and learn together with your friends!
 Twaylor:
Time flies doesn't it? I tried to not be the second squeaky wheel of the household and ended up hurting myself and others severely.
Twaylor:
Time flies doesn't it? I tried to not be the second squeaky wheel of the household and ended up hurting myself and others severely.
 clllaaaaaire:
any tips? the quality isn't the best because I am using this site on my computer
clllaaaaaire:
any tips? the quality isn't the best because I am using this site on my computer
 Midnight97:
Kinda a roleplay story between me and my friend enjoy... Part one Forgive me for all the screenshots.
Midnight97:
Kinda a roleplay story between me and my friend enjoy... Part one Forgive me for all the screenshots.
 StevenisGhost:
what type of song should I make next, and will y'all go check out my new song on
Midnight97:
My drawing sure changed over the years look at these two pictures from 2024 to no
StevenisGhost:
what type of song should I make next, and will y'all go check out my new song on
Midnight97:
My drawing sure changed over the years look at these two pictures from 2024 to no
 EdwinJsHispanic:
"poem" love is So Beautiful to have. But it's so hard to have. At this point I don't know whether its worth the wait Or if it's just millions of miles to re
EdwinJsHispanic:
"poem" love is So Beautiful to have. But it's so hard to have. At this point I don't know whether its worth the wait Or if it's just millions of miles to re
EdwinJsHispanic:
"poem" love is So Beautiful to have. But it's so hard to have. At this point I don't know whether its worth the wait Or if it's just millions of miles to re
EdwinJsHispanic:
"poem" love is So Beautiful to have. But it's so hard to have. At this point I don't know whether its worth the wait Or if it's just millions of miles to re
 Breathless:
I don't know if this would be considered art, but its close enough I believe, Any
Breathless:
I don't know if this would be considered art, but its close enough I believe, Any