 pandasurvive:
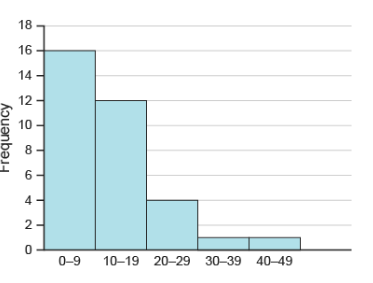
Which description best fits the distribution of the data shown in the histogram? approximately bell-shaped uniform skewed left skewed right
pandasurvive:
@psirockin2 can you help me when you have a chance?
pandasurvive:
@Ultrilliam do you know anyone who can help me with a few questions?
 KittyNoir:
I CAN!!!
pandasurvive:
That would be great CX
pandasurvive:
@KittyNoir
KittyNoir:
one moment thinking
KittyNoir:
where is the histogram
KittyNoir:
Which One Has the highest number of things
 psirockin2:
I can but i'll need it snipped
pandasurvive:
what sniped? @psirockin2
psirockin2:
the snipping tool... i can't open printscreen
pandasurvive:
ok
 psirockin2:
skewed left
pandasurvive:
thanks :D
pandasurvive:
Would you be able to help me with a few more in a little bit?
psirockin2:
i believe so
pandasurvive:
thank you
pandasurvive:
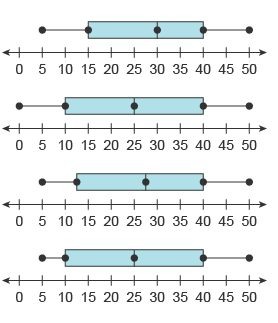
Which box plot represents the data? 30, 35, 25, 5, 5, 25, 40, 45, 50, 10, 15, 40
 pandasurvive:
@psirockin2
KittyNoir:
@psirockin2 ^
psirockin2:
I'm thinking box 1
pandasurvive:
ok
pandasurvive:
Which statement about the data is true? 724, 727, 996, 712, 725, 704, 730, 710 Both the median and mode are appropriate measures of center. The median is the only appropriate measure of center. The mean, median, and mode are all appropriate measures of center. Both the mean and median are appropriate measures of center. I think its B but I am not sure
pandasurvive:
@psirockin2
pandasurvive:
@Hero for when you are done resting
psirockin2:
Sorry. Had to take my little sister to her band practice.
psirockin2:
And I was thinking more towards D.
KittyNoir:
|dw:1493941610700:dw|
psirockin2:
^Cute
KittyNoir:
THX I like to paint and draw
KittyNoir:
I'm the kitty and Panda is the adorable Panda
 Hero:
Hero:
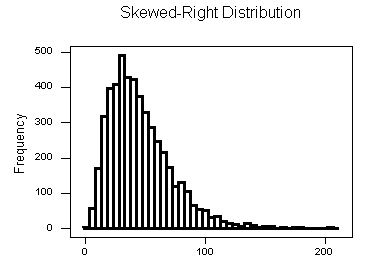
A few things: 1. A "skewed right" distribution is one in which the tail is on the right side. A "skewed left" distribution is one in which the tail is on the left side. 2. Only post one question at a time. This is necessary proper reference back to a specific question can be made.
 Hero:
Hero:
@pandasurvive do you have anything you want to say regarding my post?
pandasurvive:
@Hero I am sorry I didnt get a notification. Thank you for the help and I will delete this post soon, I am just doing something atm.
pandasurvive:
@Hero so double checking its skewed right?
Hero:
If you're asking about the original question, yes.
pandasurvive:
@Hero ok thank you
Join our real-time social learning platform and learn together with your friends!
 natalieee:
who else wants a job in biology? I love biomedical science and want to work with
natalieee:
who else wants a job in biology? I love biomedical science and want to work with
 Twaylor:
Time flies doesn't it? I tried to not be the second squeaky wheel of the household and ended up hurting myself and others severely.
Twaylor:
Time flies doesn't it? I tried to not be the second squeaky wheel of the household and ended up hurting myself and others severely.
 clllaaaaaire:
any tips? the quality isn't the best because I am using this site on my computer
clllaaaaaire:
any tips? the quality isn't the best because I am using this site on my computer
 Midnight97:
Kinda a roleplay story between me and my friend enjoy... Part one Forgive me for all the screenshots.
Midnight97:
Kinda a roleplay story between me and my friend enjoy... Part one Forgive me for all the screenshots.
 StevenisGhost:
what type of song should I make next, and will y'all go check out my new song on
Midnight97:
My drawing sure changed over the years look at these two pictures from 2024 to no
StevenisGhost:
what type of song should I make next, and will y'all go check out my new song on
Midnight97:
My drawing sure changed over the years look at these two pictures from 2024 to no
 EdwinJsHispanic:
"poem" love is So Beautiful to have. But it's so hard to have. At this point I don't know whether its worth the wait Or if it's just millions of miles to re
EdwinJsHispanic:
"poem" love is So Beautiful to have. But it's so hard to have. At this point I don't know whether its worth the wait Or if it's just millions of miles to re
EdwinJsHispanic:
"poem" love is So Beautiful to have. But it's so hard to have. At this point I don't know whether its worth the wait Or if it's just millions of miles to re
EdwinJsHispanic:
"poem" love is So Beautiful to have. But it's so hard to have. At this point I don't know whether its worth the wait Or if it's just millions of miles to re