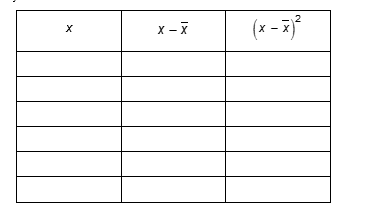
2. The data set shows the weights of pumpkins, in pounds, that are chosen for a photograph in a farming magazine. 18 22 14 30 26 (a) What is the mean, , of the data set? (b) What is the sum of the squares of the differences between each data value and the mean? Use the table to organize your work. x (c) What is the standard deviation of the data set? Use the sum from Part (b) and show your work. (d) A second group of pumpkins, with weights of 32, 35, 33, 34, and 36 pounds, are chosen for another photograph. Will the standard deviation of these weights be gr
 Nnesha:
x_1=18 x_2= 22 x_3=14 x_4=30 x_5=26 Mean is the average: (add all the numbers divided by the number of total numbers in the list)
Nnesha:
x-bar represents the mean value.
Nnesha:
|dw:1494451518703:dw| standard deviation. add all the values in column 3, divide by the ( total number in the list minus 1) and then take the square root.
Nnesha:
bad handwriting o.o oh well...
Join our real-time social learning platform and learn together with your friends!
 Twaylor:
Time flies doesn't it? I tried to not be the second squeaky wheel of the household and ended up hurting myself and others severely.
Twaylor:
Time flies doesn't it? I tried to not be the second squeaky wheel of the household and ended up hurting myself and others severely.
 clllaaaaaire:
any tips? the quality isn't the best because I am using this site on my computer
clllaaaaaire:
any tips? the quality isn't the best because I am using this site on my computer
 Midnight97:
Kinda a roleplay story between me and my friend enjoy... Part one Forgive me for all the screenshots.
Midnight97:
Kinda a roleplay story between me and my friend enjoy... Part one Forgive me for all the screenshots.
 StevenisGhost:
what type of song should I make next, and will y'all go check out my new song on
Midnight97:
My drawing sure changed over the years look at these two pictures from 2024 to no
StevenisGhost:
what type of song should I make next, and will y'all go check out my new song on
Midnight97:
My drawing sure changed over the years look at these two pictures from 2024 to no
 EdwinJsHispanic:
"poem" love is So Beautiful to have. But it's so hard to have. At this point I don't know whether its worth the wait Or if it's just millions of miles to re
EdwinJsHispanic:
"poem" love is So Beautiful to have. But it's so hard to have. At this point I don't know whether its worth the wait Or if it's just millions of miles to re
EdwinJsHispanic:
"poem" love is So Beautiful to have. But it's so hard to have. At this point I don't know whether its worth the wait Or if it's just millions of miles to re
EdwinJsHispanic:
"poem" love is So Beautiful to have. But it's so hard to have. At this point I don't know whether its worth the wait Or if it's just millions of miles to re
 Breathless:
I don't know if this would be considered art, but its close enough I believe, Any
Breathless:
I don't know if this would be considered art, but its close enough I believe, Any