Ask
your own question, for FREE!
Mathematics
8 Online
 AnimeGhoul8863:
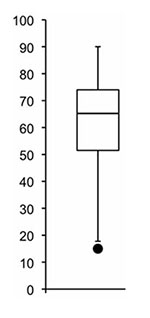
Which of the following is true of the data represented by the box plot? box plot with point at 15, min at 17, Q1 at 51, median at 65, Q3 at 74, max at 90 The data is skewed to the bottom and contains one outlier. The data is skewed to the top. The data has a symmetrical distribution and contains no outliers. The mean is most likely greater than the median.
Still Need Help?
Join the QuestionCove community and study together with friends!
 AnimeGhoul8863:
@ThisGirlPretty
AnimeGhoul8863:
@Vocaloid
 Pixel:
The data is skewed to the bottom and contains one outlier. the outlier is the point at 15 the data is skewed to the bottom because the values below the median are far more spread out; there are more extreme values that are far below the median than above the median.
Can't find your answer?
Make a FREE account and ask your own questions, OR help others and earn volunteer hours!
Join our real-time social learning platform and learn together with your friends!
Join our real-time social learning platform and learn together with your friends!
Latest Questions
 avisshomes:
What should I look for before choosing a co-living space in Gurgaon?
avisshomes:
What should I look for before choosing a co-living space in Gurgaon?
 Twaylor:
Time flies doesn't it? I tried to not be the second squeaky wheel of the household and ended up hurting myself and others severely.
Twaylor:
Time flies doesn't it? I tried to not be the second squeaky wheel of the household and ended up hurting myself and others severely.
 clllaaaaaire:
any tips? the quality isn't the best because I am using this site on my computer
clllaaaaaire:
any tips? the quality isn't the best because I am using this site on my computer
 Midnight97:
Kinda a roleplay story between me and my friend enjoy... Part one Forgive me for all the screenshots.
Midnight97:
Kinda a roleplay story between me and my friend enjoy... Part one Forgive me for all the screenshots.
 StevenisGhost:
what type of song should I make next, and will y'all go check out my new song on
Midnight97:
My drawing sure changed over the years look at these two pictures from 2024 to no
StevenisGhost:
what type of song should I make next, and will y'all go check out my new song on
Midnight97:
My drawing sure changed over the years look at these two pictures from 2024 to no
 EdwinJsHispanic:
"poem" love is So Beautiful to have. But it's so hard to have. At this point I don't know whether its worth the wait Or if it's just millions of miles to re
EdwinJsHispanic:
"poem" love is So Beautiful to have. But it's so hard to have. At this point I don't know whether its worth the wait Or if it's just millions of miles to re
EdwinJsHispanic:
"poem" love is So Beautiful to have. But it's so hard to have. At this point I don't know whether its worth the wait Or if it's just millions of miles to re
EdwinJsHispanic:
"poem" love is So Beautiful to have. But it's so hard to have. At this point I don't know whether its worth the wait Or if it's just millions of miles to re
 Breathless:
I don't know if this would be considered art, but its close enough I believe, Any
Breathless:
I don't know if this would be considered art, but its close enough I believe, Any
1 day ago
6 Replies
0 Medals
Twaylor:
Time flies doesn't it? I tried to not be the second squeaky wheel of the household and ended up hurting myself and others severely.
3 days ago
12 Replies
2 Medals
clllaaaaaire:
any tips? the quality isn't the best because I am using this site on my computer
2 weeks ago
2 Replies
0 Medals
Midnight97:
Kinda a roleplay story between me and my friend enjoy... Part one Forgive me for all the screenshots.
3 weeks ago
2 Replies
1 Medal
StevenisGhost:
what type of song should I make next, and will y'all go check out my new song on
2 weeks ago
6 Replies
2 Medals
Midnight97:
My drawing sure changed over the years look at these two pictures from 2024 to no
3 weeks ago
6 Replies
1 Medal
EdwinJsHispanic:
"poem" love is So Beautiful to have. But it's so hard to have. At this point I don't know whether its worth the wait Or if it's just millions of miles to re
3 weeks ago
3 Replies
0 Medals
EdwinJsHispanic:
"poem" love is So Beautiful to have. But it's so hard to have. At this point I don't know whether its worth the wait Or if it's just millions of miles to re
3 weeks ago
0 Replies
0 Medals
Breathless:
I don't know if this would be considered art, but its close enough I believe, Any
4 weeks ago
3 Replies
0 Medals