 AnimeGhoul8863:
The following table shows the number of hours some high school students in two states spend surfing the Internet each week: State A 35 36 35 34 35 38 36 36 38 State B 24 22 20 50 25 24 65 25 26 Part A: Create a five-number summary and calculate the interquartile range for the two sets of data. (6 points) Part B: Are the box plots symmetric? Justify your answer. (4 points)
AnimeGhoul8863:
@Vocaloid
AnimeGhoul8863:
@ThisGirlPretty
AnimeGhoul8863:
HELP
 ThisGirlPretty:
@563blackghost
 563blackghost:
summoned!
AnimeGhoul8863:
can u help blackghost
563blackghost:
Sorry I was looking at something real quick, yes i can help!
563blackghost:
though I don't know what a five-number summary is, but i do know how to find the interquartile range......
AnimeGhoul8863:
YEAH!!!!!
563blackghost:
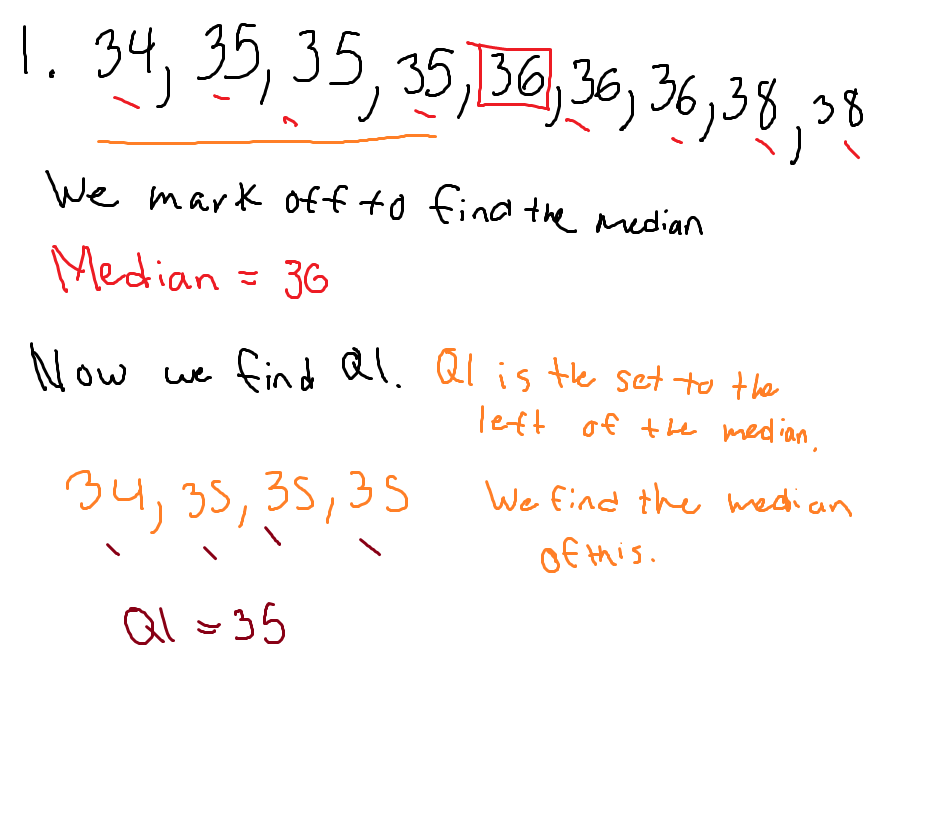
First you need to identify the median. First list the sets in order from least to greatest then determine the median. Tell me what you find as the median.
AnimeGhoul8863:
ok im here sorry i was looking for a web site
AnimeGhoul8863:
umm ok so if im right
AnimeGhoul8863:
the first one the median is 36
AnimeGhoul8863:
second one is 25
AnimeGhoul8863:
ok so am i right?
563blackghost:
that's right! now we need to find the median of Q1 and Q3. To do this we need to find the median on either side of the median. Do you understand what I mean?
AnimeGhoul8863:
kinda not really can u explain
563blackghost:
List the set in order here.
AnimeGhoul8863:
like each number in order
AnimeGhoul8863:
Set 1: 34,35,35,35,36,36,36,38,38 Set 2:20,22,24,24,25,25,26,50,65
563blackghost:
one sec let meh draw dis out
AnimeGhoul8863:
ok
 563blackghost:
Q3*
AnimeGhoul8863:
UMMMMM
AnimeGhoul8863:
37 and 38
AnimeGhoul8863:
how did i do
563blackghost:
Q1 was already found as 35. So we only need to find Q3, so it is 37 :) Can you find Q1 and Q3 of the second set?
AnimeGhoul8863:
set 1 35 and 37 set 2 23 and 38
AnimeGhoul8863:
ok so am i right
563blackghost:
let meh see...
563blackghost:
That's right! Not to find the interquartile range you simply subtract Q3 by Q1! So find the difference of the quartiles.
AnimeGhoul8863:
Set 1: 2 Set 2: 15
AnimeGhoul8863:
@563blackghost
563blackghost:
CORRECT!
563blackghost:
Now you need to make the box plot for it.... |dw:1516129643325:dw| and from this determine if they are symmetrical.
AnimeGhoul8863:
UGHGHGHGGH soooo much
AnimeGhoul8863:
im confused on what to do now
563blackghost:
you just need to list the sets in a box plot, the above picture is a setup...
AnimeGhoul8863:
|dw:1516130041324:dw|
AnimeGhoul8863:
like this
563blackghost:
well one for each set.... and it needs to be on a number line....
AnimeGhoul8863:
im confused can u show me what u mean
563blackghost:
like this.... EX. |dw:1516130440333:dw|
AnimeGhoul8863:
huh i still dont get where it goes im not putting the pic as my answer so i need something different
563blackghost:
well i cant draw it out for you, you have to put it together. you already have all the data you need. Set: Minimum: 34 Q1:35 Median: 36 Q3: 37 Maximum: 38 Set 2: Minimum: 20 Q1: 23 Median:25 Q3: 38 Maximum: 65 Just make it into a box plot.....
AnimeGhoul8863:
ok thank you is that all i have to do
563blackghost:
yea just put it into a box plot, and analyze. Part 1 is already done!
AnimeGhoul8863:
ANALYZE WHAT
AnimeGhoul8863:
@563blackghost
AnimeGhoul8863:
@563blackghost
AnimeGhoul8863:
is the box plots symmertic i think yes but im not 100 certain y
AnimeGhoul8863:
@Vocaloid
AnimeGhoul8863:
@Ultrilliam
AnimeGhoul8863:
i need help finding out if its stmmertic and y @Ultrilliam
 Ultrilliam:
I can't help with that x.x
Join our real-time social learning platform and learn together with your friends!
 Twaylor:
Time flies doesn't it? I tried to not be the second squeaky wheel of the household and ended up hurting myself and others severely.
Twaylor:
Time flies doesn't it? I tried to not be the second squeaky wheel of the household and ended up hurting myself and others severely.
 clllaaaaaire:
any tips? the quality isn't the best because I am using this site on my computer
clllaaaaaire:
any tips? the quality isn't the best because I am using this site on my computer
 Midnight97:
Kinda a roleplay story between me and my friend enjoy... Part one Forgive me for all the screenshots.
Midnight97:
Kinda a roleplay story between me and my friend enjoy... Part one Forgive me for all the screenshots.
 StevenisGhost:
what type of song should I make next, and will y'all go check out my new song on
Midnight97:
My drawing sure changed over the years look at these two pictures from 2024 to no
StevenisGhost:
what type of song should I make next, and will y'all go check out my new song on
Midnight97:
My drawing sure changed over the years look at these two pictures from 2024 to no
 EdwinJsHispanic:
"poem" love is So Beautiful to have. But it's so hard to have. At this point I don't know whether its worth the wait Or if it's just millions of miles to re
EdwinJsHispanic:
"poem" love is So Beautiful to have. But it's so hard to have. At this point I don't know whether its worth the wait Or if it's just millions of miles to re
EdwinJsHispanic:
"poem" love is So Beautiful to have. But it's so hard to have. At this point I don't know whether its worth the wait Or if it's just millions of miles to re
EdwinJsHispanic:
"poem" love is So Beautiful to have. But it's so hard to have. At this point I don't know whether its worth the wait Or if it's just millions of miles to re
 Breathless:
I don't know if this would be considered art, but its close enough I believe, Any
Breathless:
I don't know if this would be considered art, but its close enough I believe, Any