 alis:
alis:
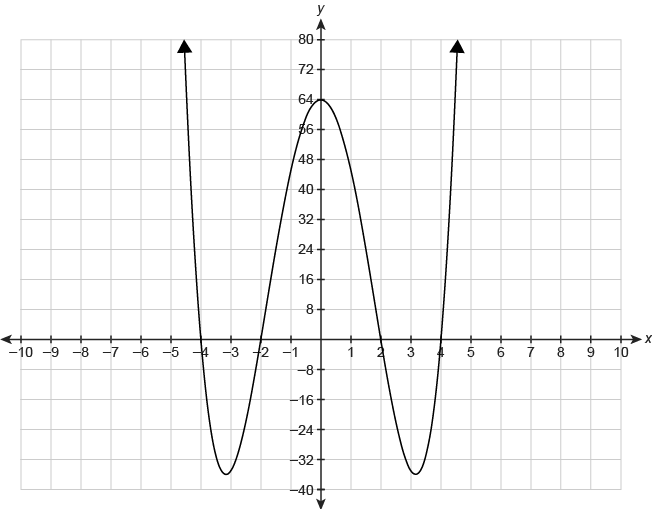
What are the relative minimum and relative maximum values over the interval [−4,4] for the function shown in the graph? I'll add the graph below.
 alis:
alis:
@Vocaloid
 Vocaloid:
the relative minima is the lowest value the graph reaches - so those two bottom peaks [you will have to estimate a decimal value]
Vocaloid:
|dw:1518107613145:dw|
Vocaloid:
relative maxima is that peak in the middle
Vocaloid:
let me know if you're having trouble estimating the values (doesn't need to be exact just reasonable)
alis:
okay. i'd say like -39ish?
Vocaloid:
it's a little closer to 32 than 40 so it's probably closer to -36 or -35
alis:
oh ok i see now it's one of choices as well so that must be it
Vocaloid:
and if we look at the x-coordinate, it's a bit to the left of -3, so -3.2 ish so (-3.2,-35) is an estimate
alis:
and that would be for relative minimum
Vocaloid:
wait are they only giving you one-coordinate?
Vocaloid:
if they're only giving one coordinate then yeah, they're both the same y-value which is -35 or -36
alis:
yes, i'm leaning towards relative min: -36 relative max: 64
Vocaloid:
good, that sounds right to me ^^
alis:
cool! thx :)
Join our real-time social learning platform and learn together with your friends!
 Twaylor:
Time flies doesn't it? I tried to not be the second squeaky wheel of the household and ended up hurting myself and others severely.
Twaylor:
Time flies doesn't it? I tried to not be the second squeaky wheel of the household and ended up hurting myself and others severely.
 clllaaaaaire:
any tips? the quality isn't the best because I am using this site on my computer
clllaaaaaire:
any tips? the quality isn't the best because I am using this site on my computer
 Midnight97:
Kinda a roleplay story between me and my friend enjoy... Part one Forgive me for all the screenshots.
Midnight97:
Kinda a roleplay story between me and my friend enjoy... Part one Forgive me for all the screenshots.
 StevenisGhost:
what type of song should I make next, and will y'all go check out my new song on
Midnight97:
My drawing sure changed over the years look at these two pictures from 2024 to no
StevenisGhost:
what type of song should I make next, and will y'all go check out my new song on
Midnight97:
My drawing sure changed over the years look at these two pictures from 2024 to no
 EdwinJsHispanic:
"poem" love is So Beautiful to have. But it's so hard to have. At this point I don't know whether its worth the wait Or if it's just millions of miles to re
EdwinJsHispanic:
"poem" love is So Beautiful to have. But it's so hard to have. At this point I don't know whether its worth the wait Or if it's just millions of miles to re
EdwinJsHispanic:
"poem" love is So Beautiful to have. But it's so hard to have. At this point I don't know whether its worth the wait Or if it's just millions of miles to re
EdwinJsHispanic:
"poem" love is So Beautiful to have. But it's so hard to have. At this point I don't know whether its worth the wait Or if it's just millions of miles to re
 Breathless:
I don't know if this would be considered art, but its close enough I believe, Any
Breathless:
I don't know if this would be considered art, but its close enough I believe, Any