help
@Vocaloid
@Vocaloid
 Vocaloid:
Please post your question
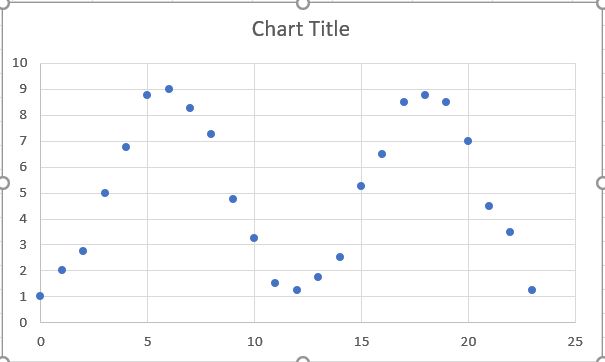
i plotted yesterday but they all look the same
?
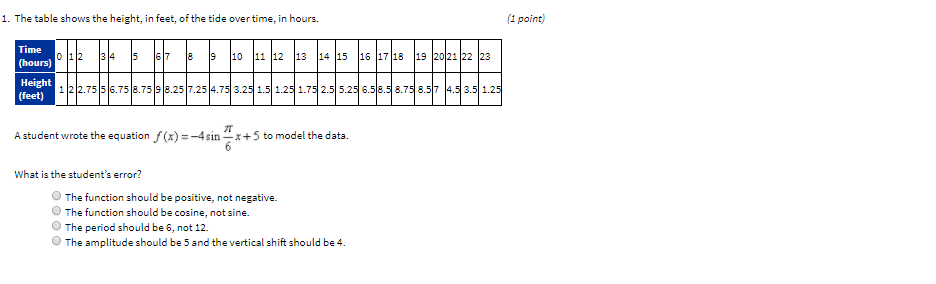
that's what i got but 12 is the period i know that
Vocaloid:
judging by this graph - the period is 12 and the amplitude is about 4, so we can eliminate C and D let's try and think about the horizontal shift
im thinking b
a looked correct when i graphed it
Vocaloid:
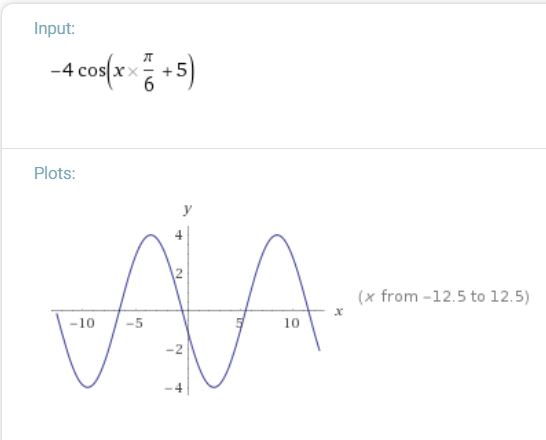
hm - if we change the function to cos this is what we get
Vocaloid:
notice how it starts decreasing from 0 instead of increasing like the actual function
okay could you help with more this topic is kind of confusing
@Vocaloid
@sillybilly123
is it a
 sillybilly123:
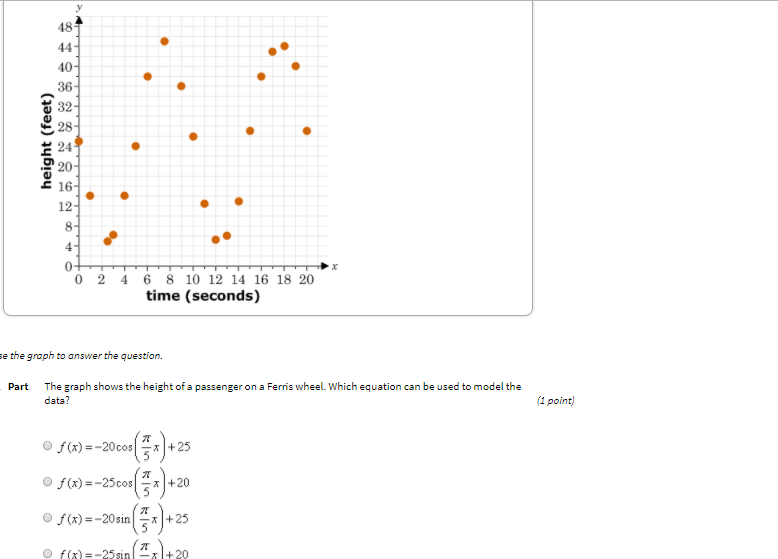
it's a negative cosine function with some shifting up the y - axis
@sillybilly123
@sillybilly123
sillybilly123:
so this looks like a negative sine function |dw:1518720857562:dw| you just gotta roll with it
sillybilly123:
period is: trough to trough; or peak to peak. which is about 10 amplitude is sorta 47 - (-4) seems to have a period of about 10 so you just roll from there
well that is still all choices that follow that
@sillybilly123
sillybilly123:
not really it is in the form \(y = - A \sin (kx) + y_o\) and \(y_o \approx 26\) So \(y - 26 = - A \sin (kx) \) And then you can add in an amplitude: \(y - 26 = - (44 - 4) \sin (kx) \) for k ,you have \(k = \dfrac{2 \pi}{\lambda}\) And: \(\lambda \approx 10\), which was the approximation mentioned above etc
Join our real-time social learning platform and learn together with your friends!
 Bounty:
the world keeps moving fast and I'm stuck in a time lapse all I need is a minute
Bounty:
can I get so tips on how to start my journey into semi-realism art also on how to
Bounty:
the world keeps moving fast and I'm stuck in a time lapse all I need is a minute
Bounty:
can I get so tips on how to start my journey into semi-realism art also on how to
 Strawberryluna:
Read my poem. Im not for criticism its a poem I wrote after my breakup: Youu2019ll never understand the way you made me break, I hate that I still love you
Bounty:
first poem in a min- (tittle)? one moment i'm fine I smile till my face burns I laugh till I cant breath Then I cry I wonder where I went wrong I listen to
Strawberryluna:
Read my poem. Im not for criticism its a poem I wrote after my breakup: Youu2019ll never understand the way you made me break, I hate that I still love you
Bounty:
first poem in a min- (tittle)? one moment i'm fine I smile till my face burns I laugh till I cant breath Then I cry I wonder where I went wrong I listen to
 Twaylor:
3d printing a glider (for 150 pound 5'8 person - prolly should make it for up to
Twaylor:
3d printing a glider (for 150 pound 5'8 person - prolly should make it for up to
 cullenn:
pitter patter sound of rain gently tapping my window tonight. calming, soothing, right? not for me.
cullenn:
pitter patter sound of rain gently tapping my window tonight. calming, soothing, right? not for me.

 Arriyanalol:
DON'T BUY TICKETS TO SEAWORLD i watched a documentary on seaworld and its sad wha
Arriyanalol:
DON'T BUY TICKETS TO SEAWORLD i watched a documentary on seaworld and its sad wha
 natalieee:
who else wants a job in biology? I love biomedical science and want to work with
natalieee:
who else wants a job in biology? I love biomedical science and want to work with