 zarkam21:
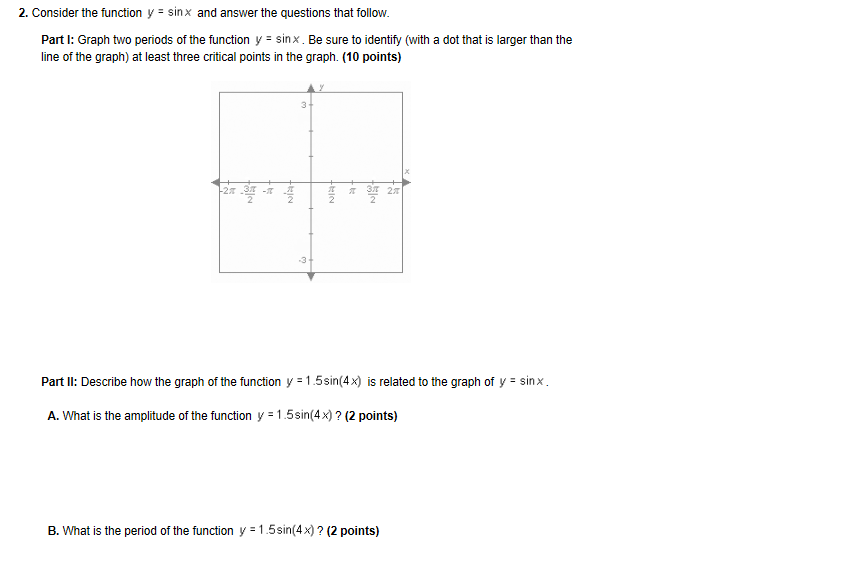
Another long question.
 Vocaloid:
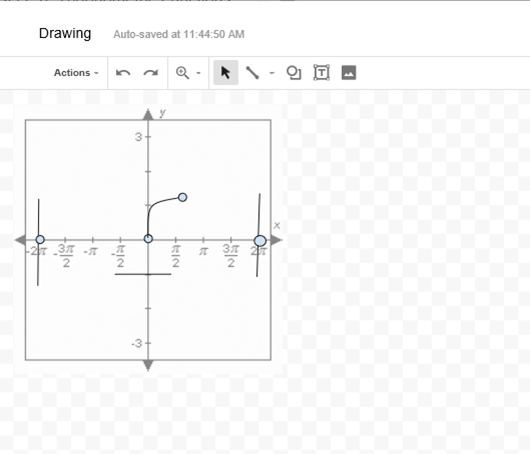
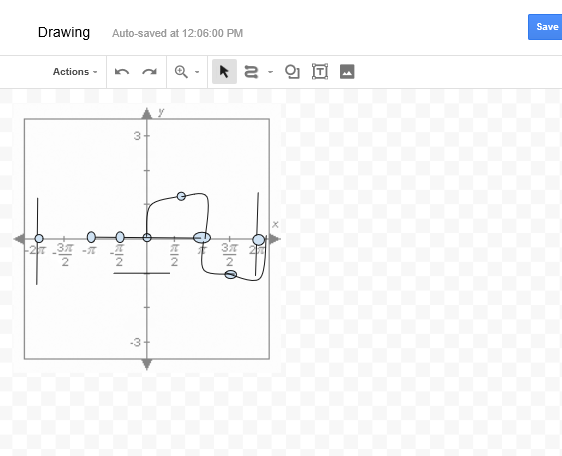
well, first step would be to sketch the graph of sin(x) from -2pi to 2pi
 Vocaloid:
for "critical points" I couldn't find a precise definition but a good idea would be to label the maximum, minimum, and x-intercepts
Vocaloid:
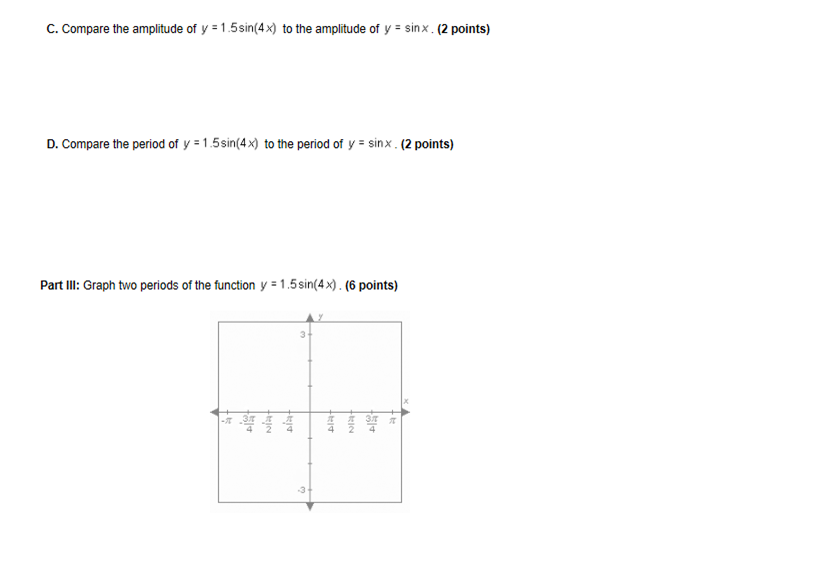
that's a good start when does sin(x) reach its maximum value 1?
zarkam21:
2
zarkam21:
wouldn't the lines connect?
Vocaloid:
hm, i'm not sure what you mean the lines you've plotted are the values when sin(x) = 0 so you would plot (-2pi,0) and (2pi,0) as your starting point then, you would find the value(s) when sin(x) = 1 and connect the points with a curved line
Vocaloid:
for example, sin(pi/2) = 1 so we could plot:
Vocaloid:
|dw:1521819653472:dw|
Vocaloid:
|dw:1521819659239:dw|
Vocaloid:
and then keep going to find other values when sin(x) = 0, 1, or -1 as our critical values
 Vocaloid:
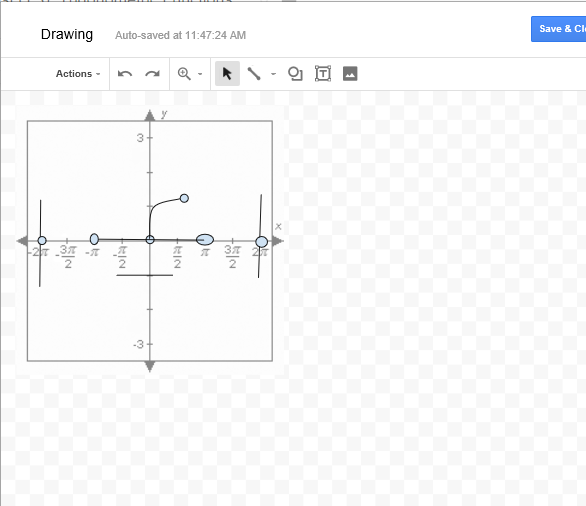
good, now what's another value when sin(x) would be 0?
zarkam21:
well 0
Vocaloid:
good, what else? it's between 0 and 2pi
zarkam21:
um -pi
zarkam21:
i mean pi
zarkam21:
wrong side sorry
Vocaloid:
good, both pi and -pi have sin values of 0, so you could plot (pi,0) and connect it
 Vocaloid:
good, then connect (pi/2,1) to (pi/0) using a curved line
Vocaloid:
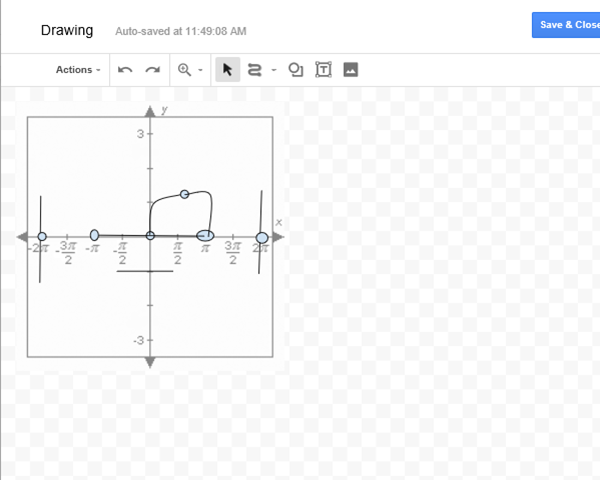
then, find a value of sin(x) where it would equal -1 and keep connecting
 zarkam21:
Okay I got this, a value of sin of -1 would b um 0?
Vocaloid:
sin(0) = 0 check the unit circle for a value of x where sin(x) = -1
zarkam21:
oh -1??
Vocaloid:
|dw:1521820278779:dw|
Vocaloid:
|dw:1521820284864:dw|
zarkam21:
oh okay so 3pi/2
Vocaloid:
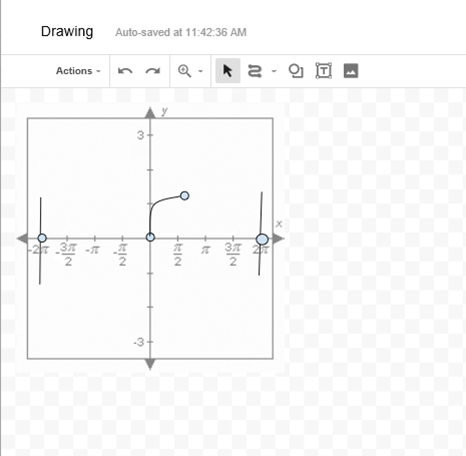
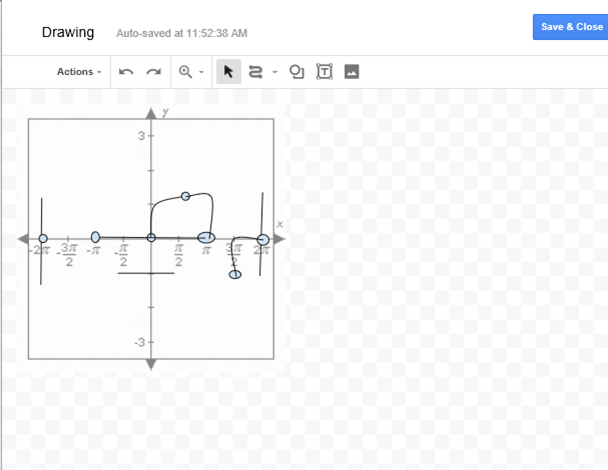
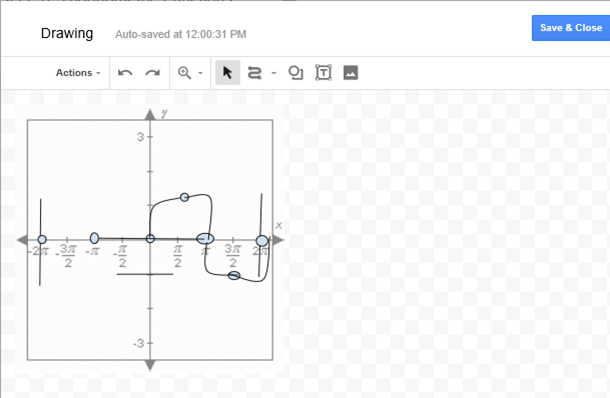
so you can plot (3pi/2, -1) and then connect it to (2pi, 0) with a curved line
zarkam21:
Sorry I was getting confused
 Vocaloid:
the curved line needs to be in the other direction like :
Vocaloid:
|dw:1521820426346:dw|
Vocaloid:
|dw:1521820431065:dw|
Vocaloid:
then these two points need to be connected like this:
Vocaloid:
|dw:1521820463096:dw|
Vocaloid:
so the overall sin graph is a nice curve like so:|dw:1521820480145:dw|
 zarkam21:
like that kind of
Vocaloid:
yeah just make it a little neater so the line crosses through the points its supposed to
Vocaloid:
like the two blue dots
 Vocaloid:
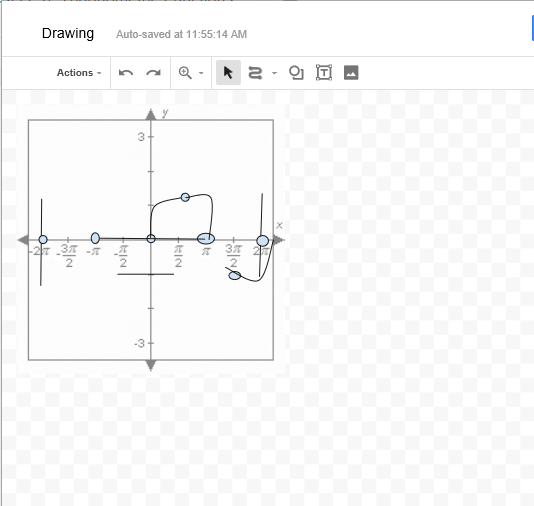
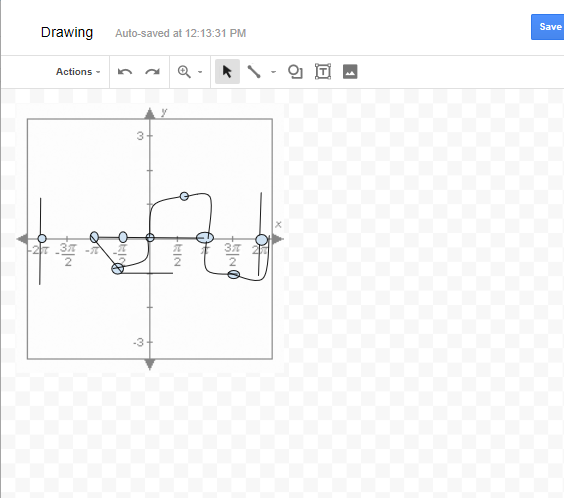
good now connect (pi,0) and (3pi/2, -1) with a smooth curved line
 Vocaloid:
other way around
Vocaloid:
|dw:1521820763198:dw|
Vocaloid:
|dw:1521820777464:dw|
Vocaloid:
I would recommend keeping a sin(x) graph next to you as a reference
Vocaloid:
|dw:1521820807889:dw|
 Vocaloid:
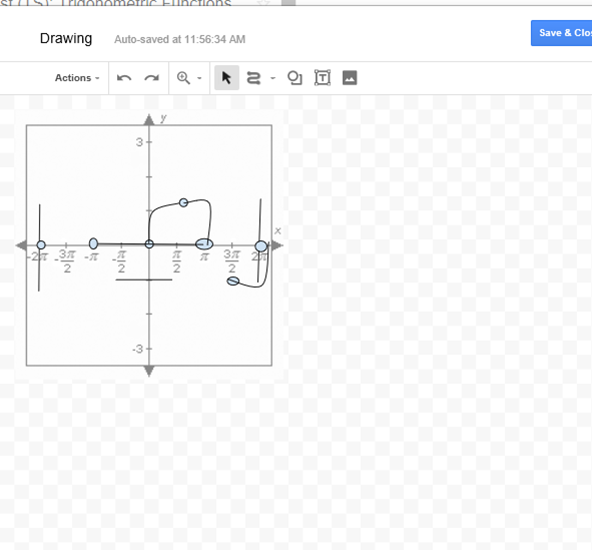
good now for the left side, what x-value would sin(x) = -1?
zarkam21:
pi
zarkam21:
or wait 3pi/2
Vocaloid:
good but we want to extend the graph on the left side, and if you remember we can subtract/add 2pi to an angle to get an "equivalent" one so 3pi/2 - 2pi = ? gives you another value when sin(x) = -1
zarkam21:
-pi/2
 zarkam21:
okay so graphed that
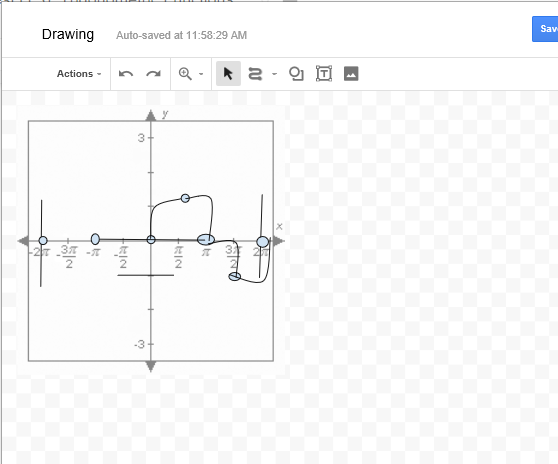
Vocaloid:
(sorry got distracted by mod stuff) sin(pi/2) = -1 not 0
Vocaloid:
|dw:1521821501647:dw|
Vocaloid:
|dw:1521821506810:dw|
Vocaloid:
something like that
Vocaloid:
then connect that to (-pi,0) with a curved line
 Vocaloid:
needs to be a curved line
Vocaloid:
|dw:1521821660423:dw|
 Vocaloid:
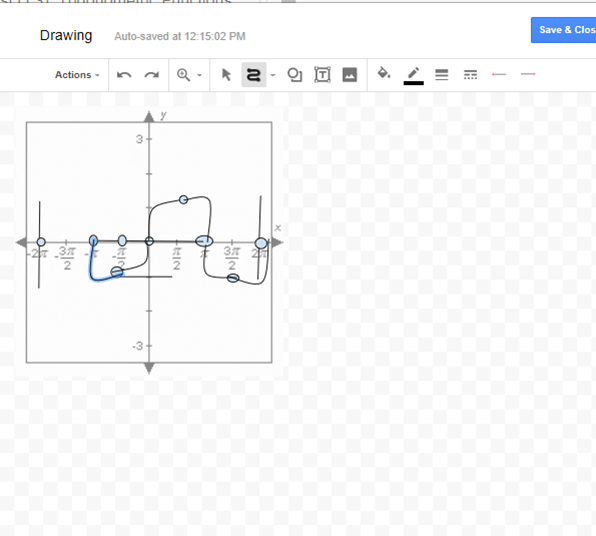
better so, what x-value would sin(x) = 1 on the left side of the graph?
zarkam21:
um 3
Vocaloid:
as a hint we determined that sin(pi/2) = 1 so pi/2 - 2pi = gives you another place where sin(x) = 1
Vocaloid:
pi/2 - 2pi = -3pi/2, plot (-3pi/2, 1) then connect w/ a smooth curved line as usual
Vocaloid:
|dw:1521822460976:dw|
Vocaloid:
|dw:1521822466222:dw|
Vocaloid:
and that's it
Vocaloid:
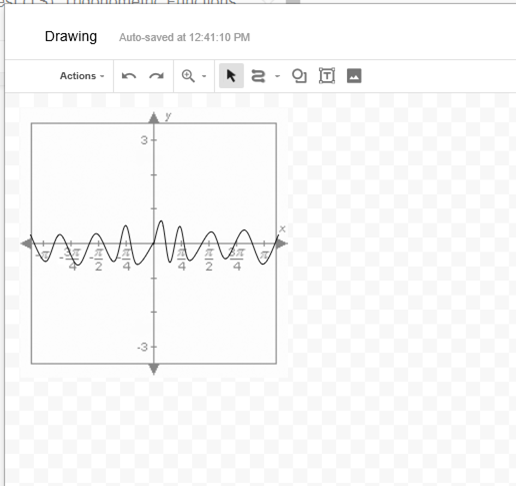
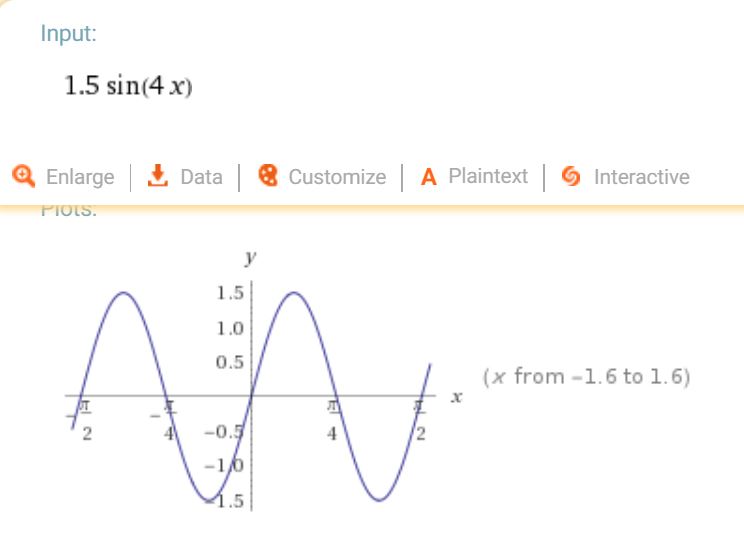
that kind of took a while but the rest of the worksheet is a lot easier thankfully like for part IIA) amplitude of 1.5sin(4x) = ?
zarkam21:
1.5
Vocaloid:
awesome for part IIB) period = 2pi/b where b is the coefficient of x since the coefficient of x is 4, period = ? [leave in terms of pi, dont' round to a decimal]
zarkam21:
pi/2
Vocaloid:
awesome for C) just compare the amplitudes of 1.5sin(4x) and sin(x) by stating "the amplitude of 1.5sin(4x) is 1.5 while the amplitude of sin(x) is 1", similar process for part D
zarkam21:
The period of 1.5sin(4x) is 1.5 while the period of sin(x) is 1 woul it be this
Vocaloid:
yes, and then repeat for the periods (recall that the period of sin(x) is 2pi and the period of 1.5sin(4x) is pi/2 like we calculated before
zarkam21:
The period of 1.5sin(4x) is pi/2 while the period of sin(x) is 2pi
Vocaloid:
good for part E) do you know how you would approach graphing it?
Vocaloid:
part III I mean
zarkam21:
graph 1.5sin(4x) right
Vocaloid:
yes, do you need any help with that?
zarkam21:
Let me try and and then yu can check it if that is alright
Vocaloid:
sure
zarkam21:
Dont want to fish for answers, ya know
 zarkam21:
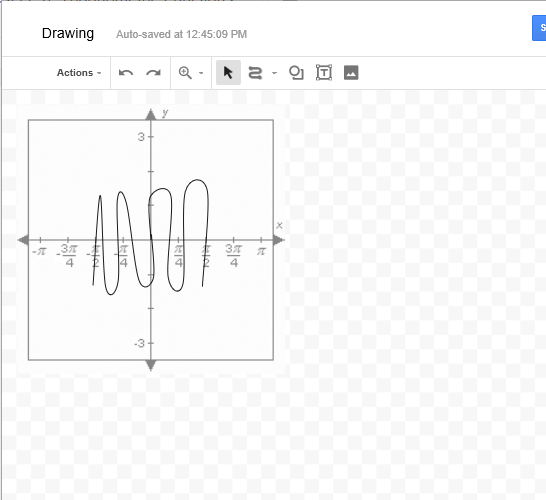
Would it be something like this
Vocaloid:
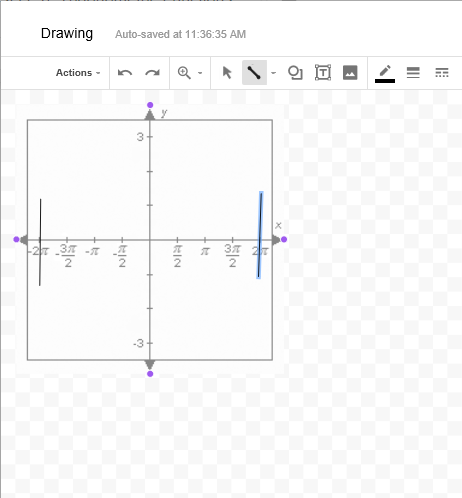
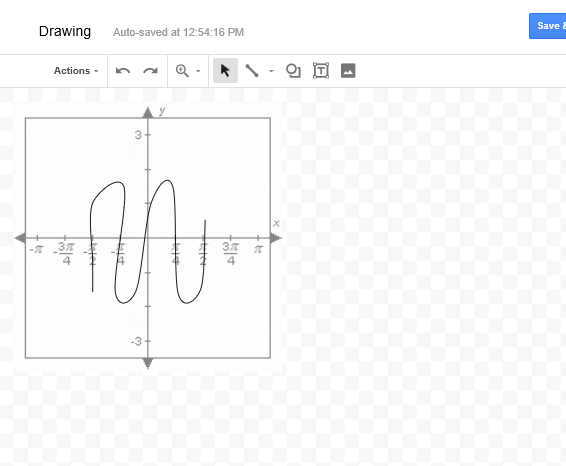
two things the amplitude is 1.5 so the graph needs to go up to 1.5 and down to -1.5 the period is pi/2 and it only wants 2 periods so the graph should start at -pi/2 and end at pi/2
 Vocaloid:
that's a good attempt, but 2 periods only means 2 cycles of the graph, so:
Vocaloid:
|dw:1521823571038:dw|
Vocaloid:
|dw:1521823575899:dw|
Vocaloid:
that's the first cycle (sorry if it's hard to see, I can re-draw it neater)
Vocaloid:
|dw:1521823613247:dw|
Vocaloid:
and then the second cycle
 Vocaloid:
something like that
 Vocaloid:
almost there just make sure the maximum/minimum is 1.5 and -1.5 respectively also the graph needs to start and end on (-pi/2,0), so: (pi/2,0)
Vocaloid:
|dw:1521823891505:dw|
Vocaloid:
|dw:1521823896767:dw|
Vocaloid:
the meat is there it just needs to be tidied up a bit, you can put lines at -1.5 and 1.5 to help guide you as long as you delete them later
 zarkam21:
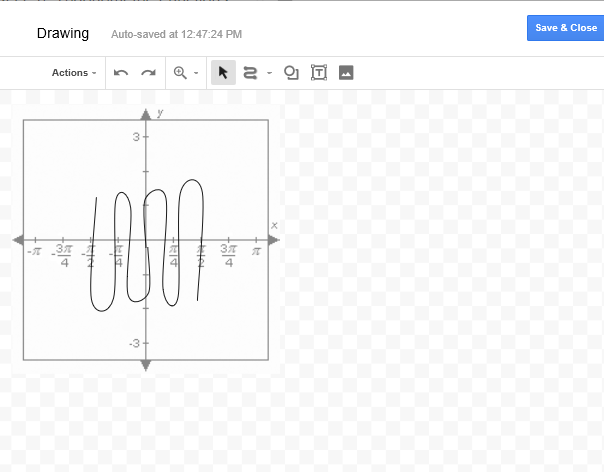
Phew, I think this is it
zarkam21:
this is the graph
Vocaloid:
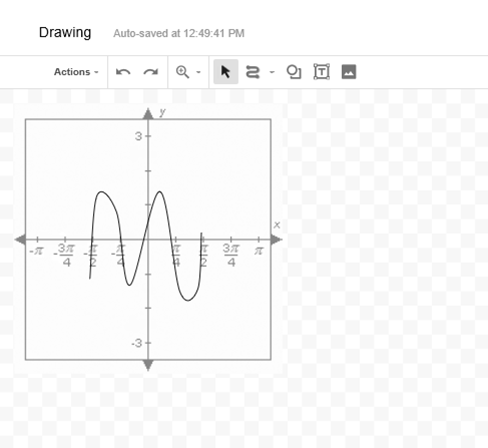
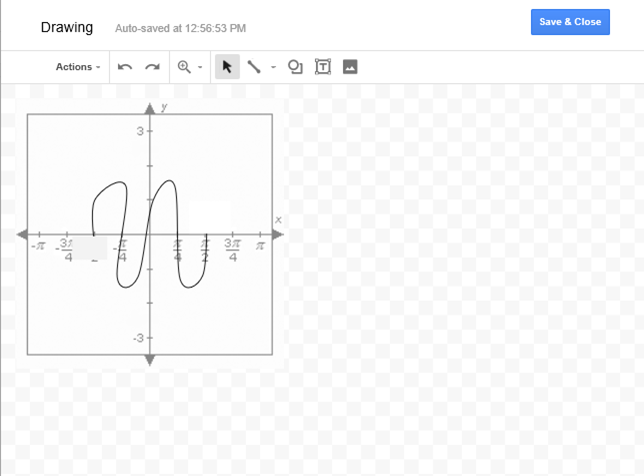
almost there ^_^ just need to trim off those ends and make the graph start and end at (-pi/2,0) and (pi/2,0)
Vocaloid:
|dw:1521824136044:dw|
Vocaloid:
|dw:1521824140695:dw|
 Vocaloid:
perfect
zarkam21:
Ugh thank you sooo miuch, really is so dreading
Join our real-time social learning platform and learn together with your friends!
 Bounty:
the world keeps moving fast and I'm stuck in a time lapse all I need is a minute
Bounty:
can I get so tips on how to start my journey into semi-realism art also on how to
Bounty:
the world keeps moving fast and I'm stuck in a time lapse all I need is a minute
Bounty:
can I get so tips on how to start my journey into semi-realism art also on how to
 Strawberryluna:
Read my poem. Im not for criticism its a poem I wrote after my breakup: Youu2019ll never understand the way you made me break, I hate that I still love you
Bounty:
first poem in a min- (tittle)? one moment i'm fine I smile till my face burns I laugh till I cant breath Then I cry I wonder where I went wrong I listen to
Strawberryluna:
Read my poem. Im not for criticism its a poem I wrote after my breakup: Youu2019ll never understand the way you made me break, I hate that I still love you
Bounty:
first poem in a min- (tittle)? one moment i'm fine I smile till my face burns I laugh till I cant breath Then I cry I wonder where I went wrong I listen to
 Twaylor:
3d printing a glider (for 150 pound 5'8 person - prolly should make it for up to
Twaylor:
3d printing a glider (for 150 pound 5'8 person - prolly should make it for up to
 cullenn:
pitter patter sound of rain gently tapping my window tonight. calming, soothing, right? not for me.
cullenn:
pitter patter sound of rain gently tapping my window tonight. calming, soothing, right? not for me.

 Arriyanalol:
DON'T BUY TICKETS TO SEAWORLD i watched a documentary on seaworld and its sad wha
Arriyanalol:
DON'T BUY TICKETS TO SEAWORLD i watched a documentary on seaworld and its sad wha
 natalieee:
who else wants a job in biology? I love biomedical science and want to work with
natalieee:
who else wants a job in biology? I love biomedical science and want to work with