 zarkam21:
You (safely) bungee jump from a 200-feet tall bridge in your town. Your distance above the water's surface depends on the time since you jumped. Sketch a reasonable graph
 Vocaloid:
any thoughts on the shape/y-intercept?
zarkam21:
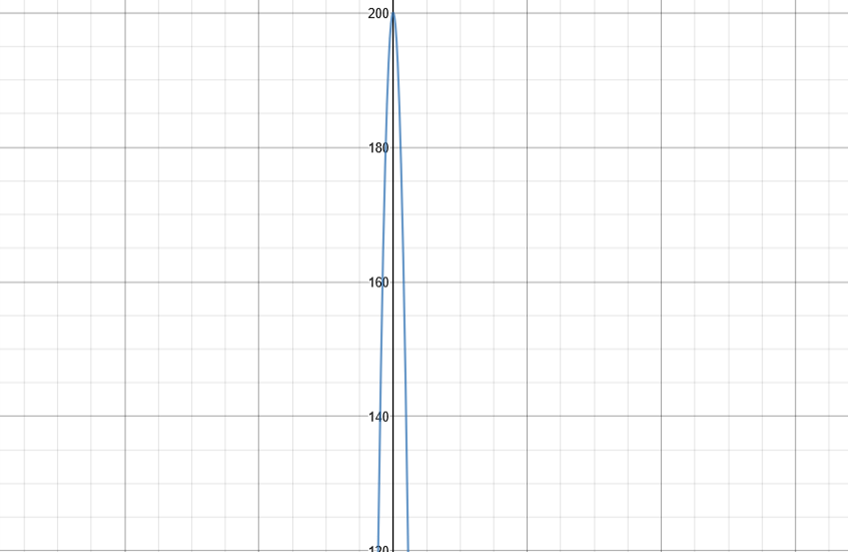
Well we would use the function h(t) = 200 - 16t^2
Vocaloid:
good, and what would that look like? (since they only want "distance above water" I'd stop the graph as soon as it reaches 0)
 Vocaloid:
good but that's just what the equation looks like in theory, in real life there are limitations on the domain/range for example, time is always positive/zero so we only want positive x-values
zarkam21:
so just move that left line over to the zero
Vocaloid:
sure
Vocaloid:
|dw:1521828334081:dw|
Vocaloid:
something like that
 Vocaloid:
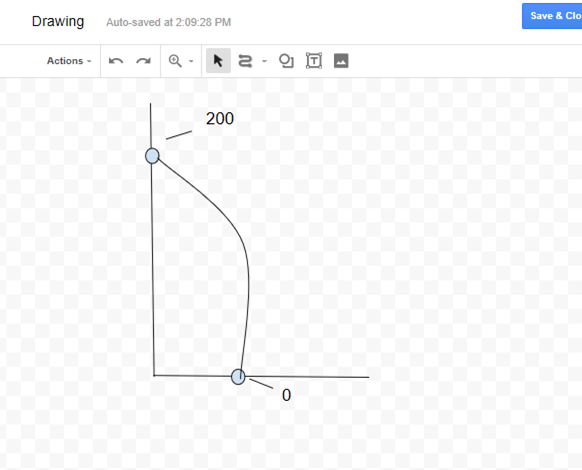
yeah that's fine, as a minor nit pick it should be a bit more like a parabola and not have that weird bulge
Vocaloid:
|dw:1521828660706:dw|
Vocaloid:
otherwise its fine
Join our real-time social learning platform and learn together with your friends!
 Bounty:
the world keeps moving fast and I'm stuck in a time lapse all I need is a minute
Bounty:
can I get so tips on how to start my journey into semi-realism art also on how to
Bounty:
the world keeps moving fast and I'm stuck in a time lapse all I need is a minute
Bounty:
can I get so tips on how to start my journey into semi-realism art also on how to
 Strawberryluna:
Read my poem. Im not for criticism its a poem I wrote after my breakup: Youu2019ll never understand the way you made me break, I hate that I still love you
Bounty:
first poem in a min- (tittle)? one moment i'm fine I smile till my face burns I laugh till I cant breath Then I cry I wonder where I went wrong I listen to
Strawberryluna:
Read my poem. Im not for criticism its a poem I wrote after my breakup: Youu2019ll never understand the way you made me break, I hate that I still love you
Bounty:
first poem in a min- (tittle)? one moment i'm fine I smile till my face burns I laugh till I cant breath Then I cry I wonder where I went wrong I listen to
 Twaylor:
3d printing a glider (for 150 pound 5'8 person - prolly should make it for up to
Twaylor:
3d printing a glider (for 150 pound 5'8 person - prolly should make it for up to
 cullenn:
pitter patter sound of rain gently tapping my window tonight. calming, soothing, right? not for me.
cullenn:
pitter patter sound of rain gently tapping my window tonight. calming, soothing, right? not for me.

 Arriyanalol:
DON'T BUY TICKETS TO SEAWORLD i watched a documentary on seaworld and its sad wha
Arriyanalol:
DON'T BUY TICKETS TO SEAWORLD i watched a documentary on seaworld and its sad wha
 natalieee:
who else wants a job in biology? I love biomedical science and want to work with
natalieee:
who else wants a job in biology? I love biomedical science and want to work with