 iosangel:
How would I do this?
 Mehek:
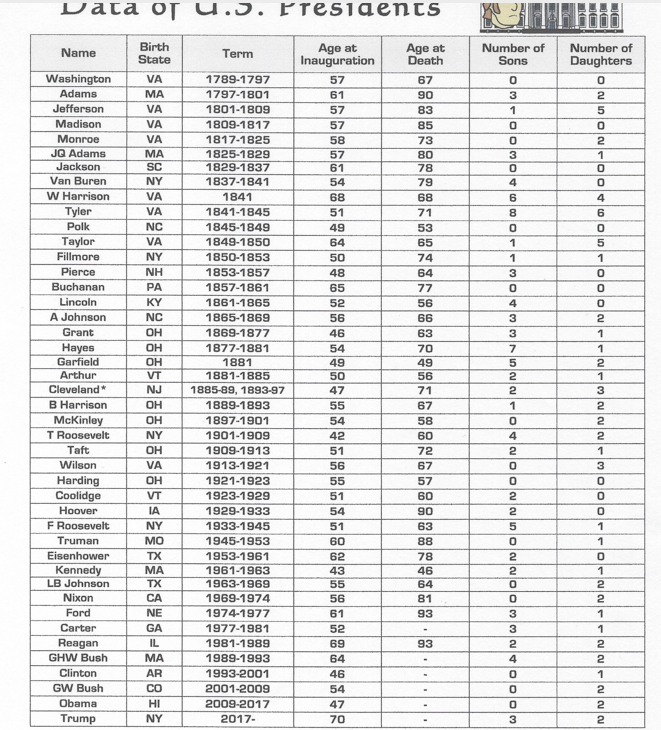
You're just going to look at the `age of death` column Start off by listing those numbers from least to greatest
iosangel:
Thats how I would create the box-and whisker plot?
Mehek:
No you need to the data first to make it
Mehek:
Then at one end you mark the smallest number, then at the other the largest Then in the middle is the median (which is why we order the numbers)
Mehek:
After that, I'll explain the 4th and 5th thing
Mehek:
|dw:1521907521899:dw|
Mehek:
and then you see the lines between the smallest number & median / median & largest to find those numbers you're going to split the data in half and find the median for both of them
iosangel:
These are the numbers in order: 42,43,46,46,47,47,48,49,49,50,50,51,51,51,51,52,52,54,54,54,54,54,55,55,55,56,56,56,57,57,57,57,58,60,61,61,61,62,64,65,68,69,70,
iosangel:
Oh, okay.
iosangel:
So the plot only needs 3 number on it?
Mehek:
5
Mehek:
Are those the numbers from age of death only?
iosangel:
Yes
iosangel:
Wait, no it isnt
Mehek:
Oh ok it seemed more to me
Mehek:
You should have 38 numbers
iosangel:
Yes, these are the numbers. 46,49,53,56,56,57,58,60,60,63,63,64,64,65,66,67,67,67,68,70,71,71,72,73,74,77,78,78,79,80,81,83,85,88
iosangel:
From least to greatest
Mehek:
ok hopefully that's all of them
Mehek:
Now since it's in order, you can find the smallest and biggest numbers and plot them
iosangel:
|dw:1521908129502:dw|
Mehek:
Correct Let me make a new one lol |dw:1521908195059:dw|
Mehek:
Now find the median of the data
iosangel:
67 is the median
Mehek:
|dw:1521908654961:dw|
iosangel:
Wait, where did you get 48?
Mehek:
Now split the data in half from the median so one should be smallest number to the number before the median and the other data should be the number after the median to the highest
Mehek:
oh whoops it was 46
iosangel:
XD
Mehek:
|dw:1521908725074:dw|
iosangel:
|dw:1521908872017:dw| Like that?
Mehek:
No split the data in half first
Mehek:
46,49,53,56,56,57,58,60,60,63,63,64,64,65,66,67,67 First half. Find the median of it 67,68,70,71,71,72,73,74,77,78,78,79,80,81,83,85,88 Second half. Find median of this as well Whatever the medians are, you will plot those
iosangel:
Oh, okay
Join our real-time social learning platform and learn together with your friends!
 Bounty:
the world keeps moving fast and I'm stuck in a time lapse all I need is a minute
Bounty:
can I get so tips on how to start my journey into semi-realism art also on how to
Bounty:
the world keeps moving fast and I'm stuck in a time lapse all I need is a minute
Bounty:
can I get so tips on how to start my journey into semi-realism art also on how to
 Strawberryluna:
Read my poem. Im not for criticism its a poem I wrote after my breakup: Youu2019ll never understand the way you made me break, I hate that I still love you
Bounty:
first poem in a min- (tittle)? one moment i'm fine I smile till my face burns I laugh till I cant breath Then I cry I wonder where I went wrong I listen to
Strawberryluna:
Read my poem. Im not for criticism its a poem I wrote after my breakup: Youu2019ll never understand the way you made me break, I hate that I still love you
Bounty:
first poem in a min- (tittle)? one moment i'm fine I smile till my face burns I laugh till I cant breath Then I cry I wonder where I went wrong I listen to
 Twaylor:
3d printing a glider (for 150 pound 5'8 person - prolly should make it for up to
Twaylor:
3d printing a glider (for 150 pound 5'8 person - prolly should make it for up to
 cullenn:
pitter patter sound of rain gently tapping my window tonight. calming, soothing, right? not for me.
cullenn:
pitter patter sound of rain gently tapping my window tonight. calming, soothing, right? not for me.

 Arriyanalol:
DON'T BUY TICKETS TO SEAWORLD i watched a documentary on seaworld and its sad wha
Arriyanalol:
DON'T BUY TICKETS TO SEAWORLD i watched a documentary on seaworld and its sad wha
 natalieee:
who else wants a job in biology? I love biomedical science and want to work with
natalieee:
who else wants a job in biology? I love biomedical science and want to work with