can i get help plz
@JustSaiyan
The growth of a population of bacteria can be modeled by the exponential function P(t) = 500 (2)tThe graph models the population of the bacteria colony P(t) as a function of the time, t, that has passed.
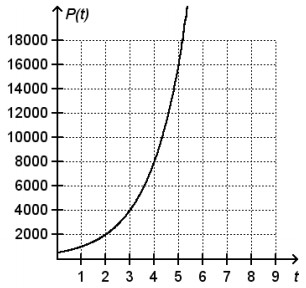
What was the average rate of change for the first four weeks of population growth? [_] bacteria per week
 JustSaiyan:
I am not that great at Math, you will want @Vocaloid when she gets on, when she has time.
@563blackghost
JustSaiyan:
@TheSmartOne
@TheSmartOne
@ThisGirlPretty
 TheSmartOne:
Average rate of change is just the slope. So what are the coordinates of the first week and the fourth week? And then use the slope formula to find it. :)
is it 1000
TheSmartOne:
Show your work
i did 500 times 2t
got 1000t
TheSmartOne:
That's not how you find the slope of two points. Also your equation is 500(2)^t
i dont know how to do this i gotta hurry im in class rn
TheSmartOne:
What are the two points when x=1 and when x=4 The formula is Slope is (y2-y1)/(x2-x1)
Join our real-time social learning platform and learn together with your friends!
 Bounty:
the world keeps moving fast and I'm stuck in a time lapse all I need is a minute
Bounty:
can I get so tips on how to start my journey into semi-realism art also on how to
Bounty:
the world keeps moving fast and I'm stuck in a time lapse all I need is a minute
Bounty:
can I get so tips on how to start my journey into semi-realism art also on how to
 Strawberryluna:
Read my poem. Im not for criticism its a poem I wrote after my breakup: Youu2019ll never understand the way you made me break, I hate that I still love you
Bounty:
first poem in a min- (tittle)? one moment i'm fine I smile till my face burns I laugh till I cant breath Then I cry I wonder where I went wrong I listen to
Strawberryluna:
Read my poem. Im not for criticism its a poem I wrote after my breakup: Youu2019ll never understand the way you made me break, I hate that I still love you
Bounty:
first poem in a min- (tittle)? one moment i'm fine I smile till my face burns I laugh till I cant breath Then I cry I wonder where I went wrong I listen to
 Twaylor:
3d printing a glider (for 150 pound 5'8 person - prolly should make it for up to
Twaylor:
3d printing a glider (for 150 pound 5'8 person - prolly should make it for up to
 cullenn:
pitter patter sound of rain gently tapping my window tonight. calming, soothing, right? not for me.
cullenn:
pitter patter sound of rain gently tapping my window tonight. calming, soothing, right? not for me.

 Arriyanalol:
DON'T BUY TICKETS TO SEAWORLD i watched a documentary on seaworld and its sad wha
Arriyanalol:
DON'T BUY TICKETS TO SEAWORLD i watched a documentary on seaworld and its sad wha
 natalieee:
who else wants a job in biology? I love biomedical science and want to work with
natalieee:
who else wants a job in biology? I love biomedical science and want to work with